CT Image Post Processing
Objectives:
- Understand the concept of post-processing
- Explain volume rendering
- Compare maximum intensity projection (MIP) and minimum intensity projection (MinIP)
- Discuss Image Fusion
Description:
The application of imaging techniques to the original axial images of a CT scan in order to derive additional information or hide unwanted information that distracts from the clinical findings is called image post-processing. Image post-processing requires the modification of a 3D image volume, which in most cases consists of a stack of individual axial images. There are many methods to do post processing. The most commonly used techniques are Maximum intensity projection (MIP), volume rendering (VR), multiplanar reconstruction (MPR) or curved planar reconstruction. We will cover all of these post processing methods in this article and show examples of many of them through CT images. This article is accredited by the ASRT for 0.25 Category A CE Credits.
Rendering Mode
There are three main methods, the minimum intensity projection, the average intensity projection, and the maximum intensity projection.
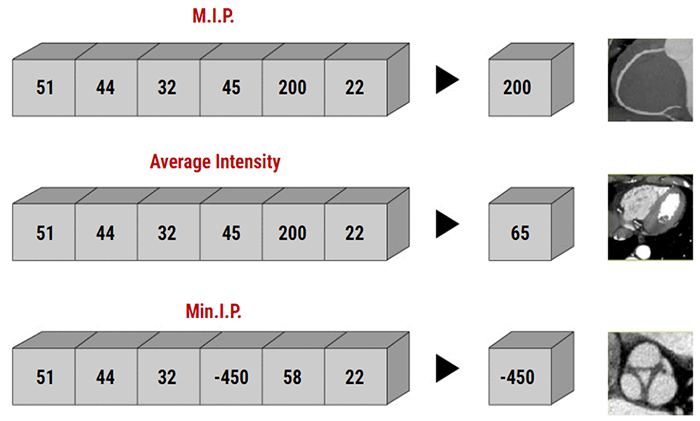
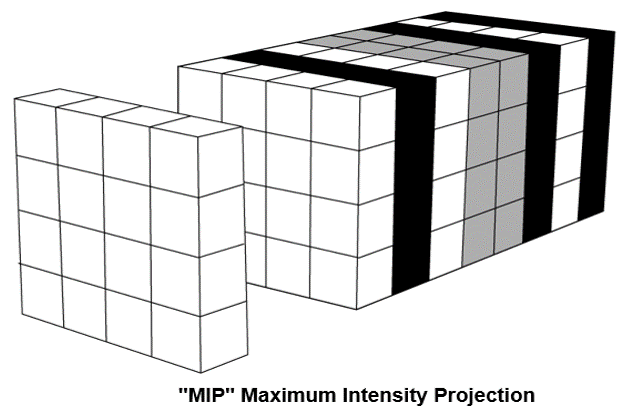
Maximum Intensity Projection: MIP
The maximum intensity projection consists of projecting the voxel with the highest attenuation value on every view throughout the volume onto a 2D image. An image that displays the maximum intensity for each pixel point on a thickened reformat plane.
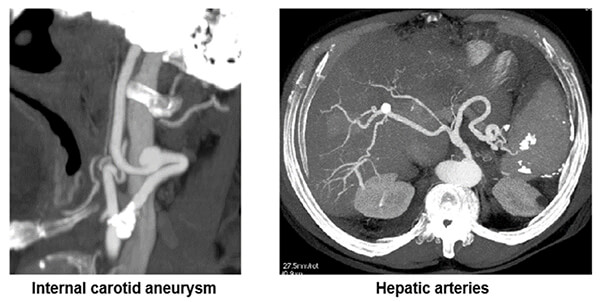
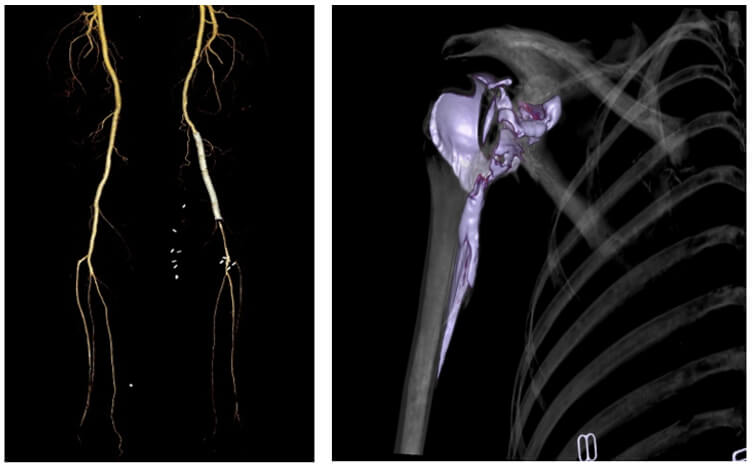
Vascular
Here an example of shows where the maximum intensity projection is used to search for vascular diseases or anomalies.
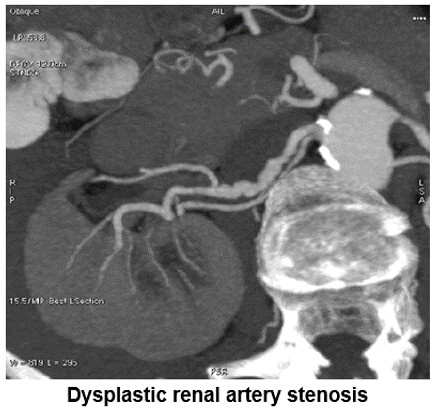
MIP Vascular: Renal Artery
This image shows us dysplastic renal artery stenosis. Notice the contour of the renal artery.
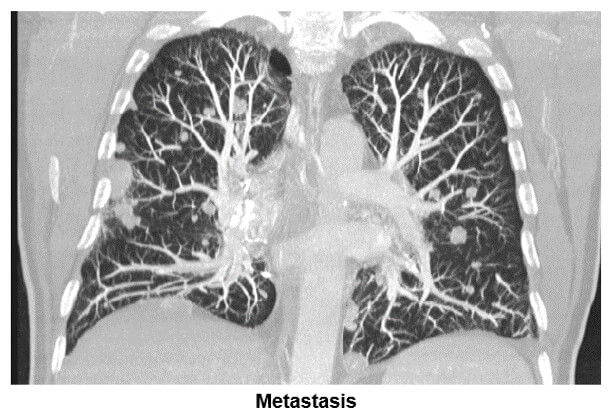
Nodules
The image shows where the maximum intensity projection is used to search for parenchyma solid nodule lesions. Notice the many metastatic lesions shown in both lung fields.
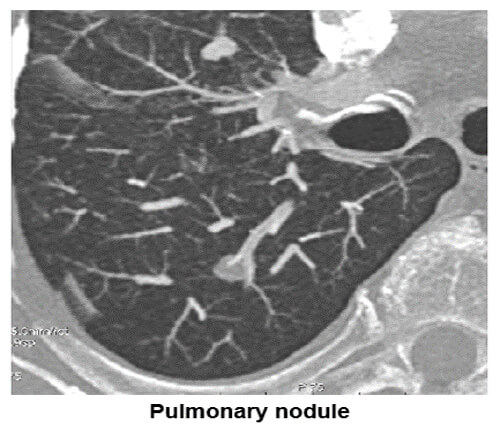
Pulmonary Nodules
The image shows where the maximum intensity projection is used to search for parenchyma solid nodular lesions. Notice the pulmonary lesion in the lung field.
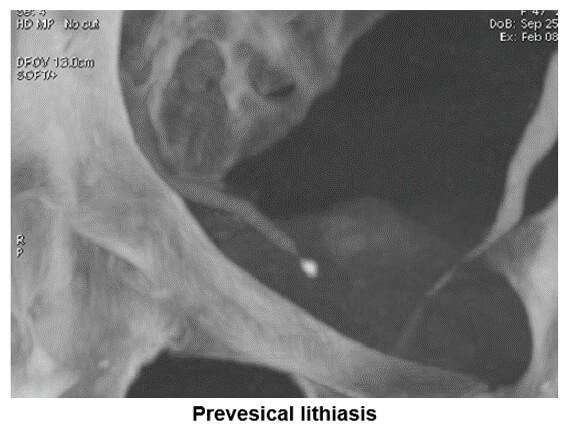
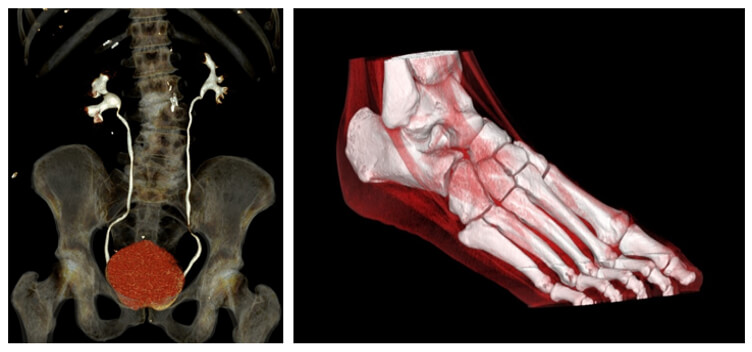
Lithiasis
You can see on this image an example of maximum intensity projection which is used to search for ureter stenosis caused by perivesical lithiasis.
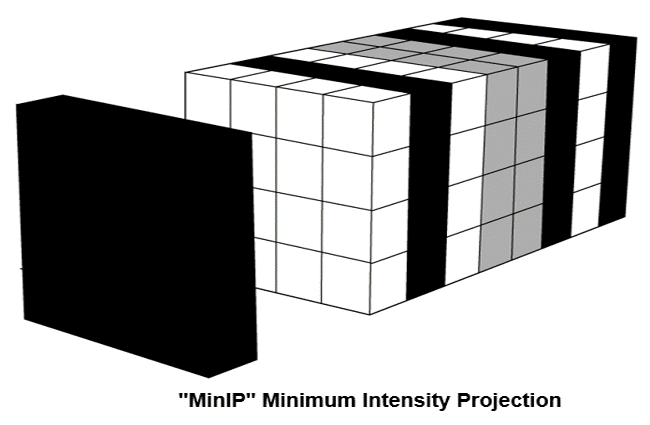
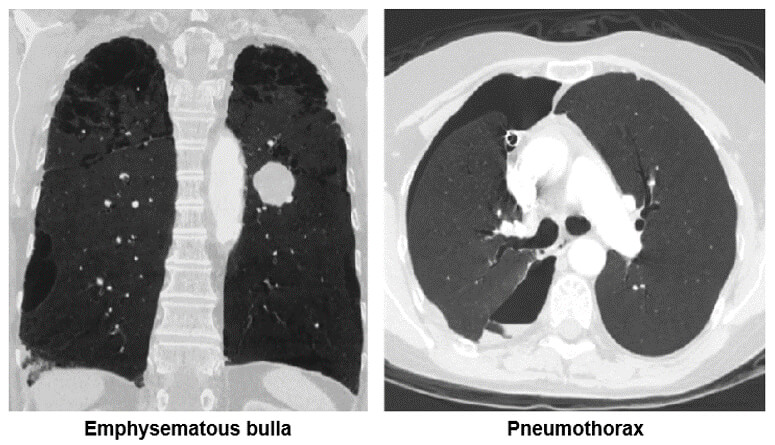
Minimum Intensity Projection: MinIP
The Minimum Intensity projection is a data visualization method that enables the detection of low-density structures in a given volume.
Chest
Both of these images show how the minimum intensity projection technique is used for the diagnosis of emphysema. Notice the bullae in the image on the left and the pneumothorax in the left lung on the image on the right.
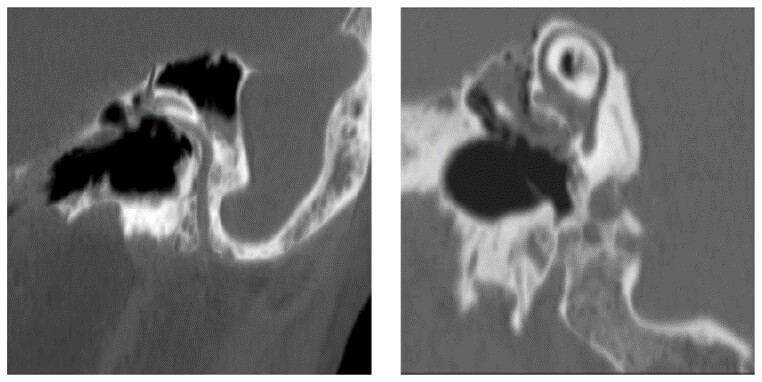
Inner Ear
On these images, we can see an example of how the minimum intensity projection is used in the diagnosis of the semicircular canal. Abnormalities such as cholesteatomas can be easily seen.
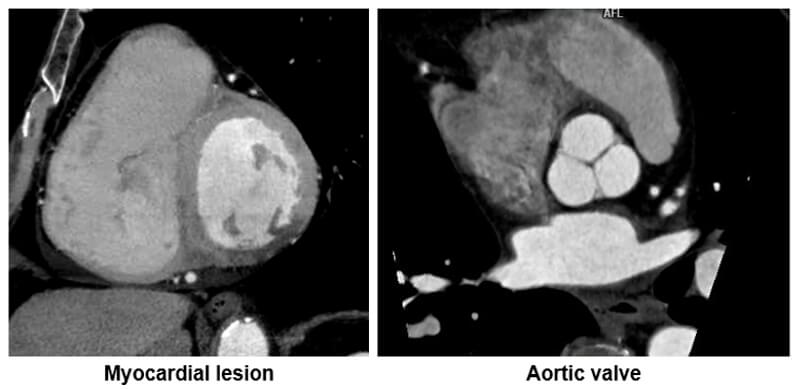
Heart
The minimum intensity algorithm is particularly useful in highlighting hypo or low dense regions within the heart.
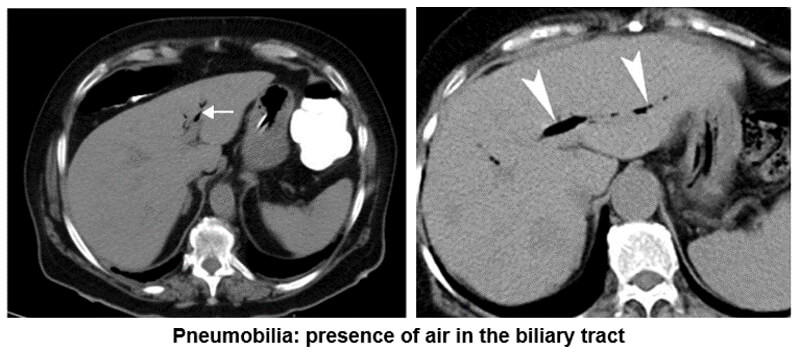
Biliary Tract
This example shows us the presence of air in the biliary tract known as pneumobilia. Notice the white arrows pointing out the air.
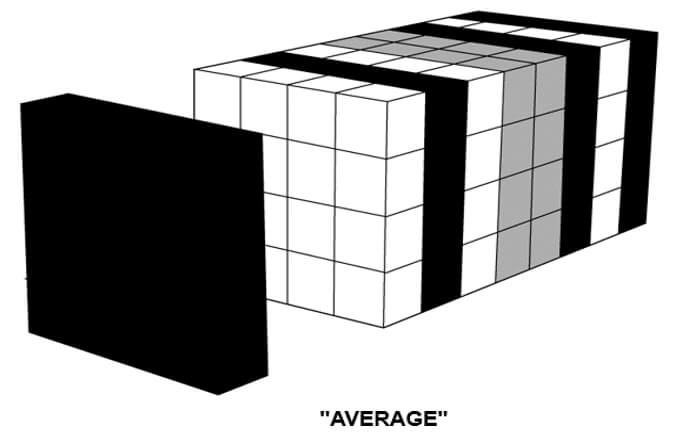
Average
In the average intensity algorithm (AIP), the visualization is averaged. The AIP technique is an algorithm that is intended to create a thick MPR image by using the average of the attenuation through the tissues of interest to calculate the pixel viewed on the computer.
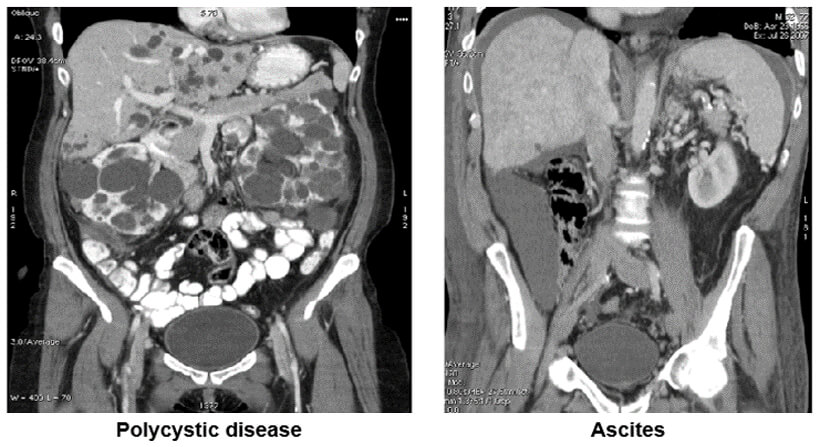
Images
In the image on the left, we see the polycystic disease of both kidneys while the image on the left shows the presence of ascites in the abdomen.
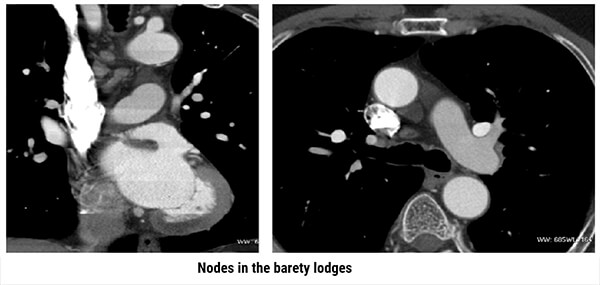
Multi Planar Reconstructions
Both images show the presence of nodes in the Barety lodge, or Baréty’s box (or right pre-tracheal space). It is an anatomical space located in the middle mediastinum of the human thorax which is formed of a cellulo-lymphatic tissue running along the trachea.
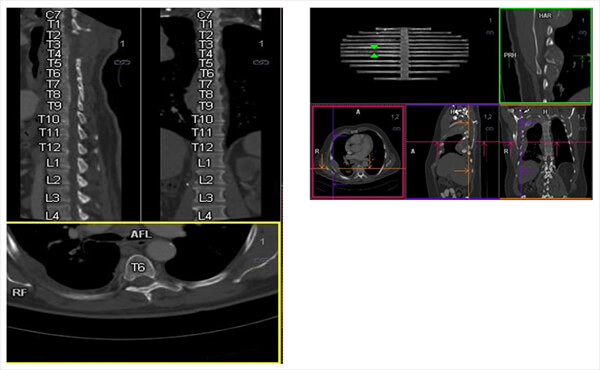
Curved
Multiplanar
The curved multiplanar axis allows the draw of a central axis inside a structure independently from its origin. (vascular or other).Visualization of sagittal and coronal vertebrae in the same plan. Also a Visualization of the coast in the same plan.
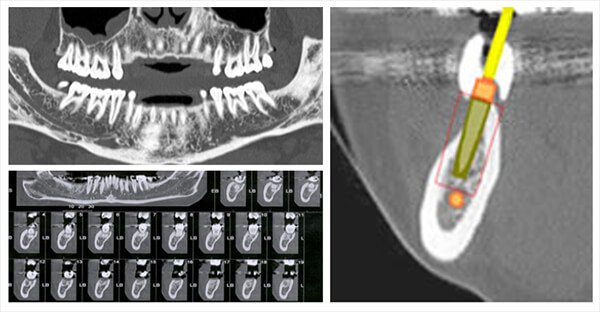
Mandible
It allows the visualization of the mandibular canal as well as the visualization of the pre implanted bony space.
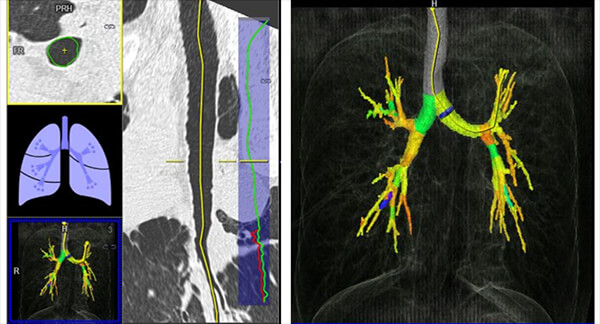
Bronchial Tree
This image shows us the visualization of the bronchial lumen and its caliber.
Post Processing
The curved post-processing algorithm allows for:
- Better visualization of a tract
- Better localization of a pathological element
- Better distance measurement (example: stenosis)
- This study can be done automatically through vascular HU or manually point by point
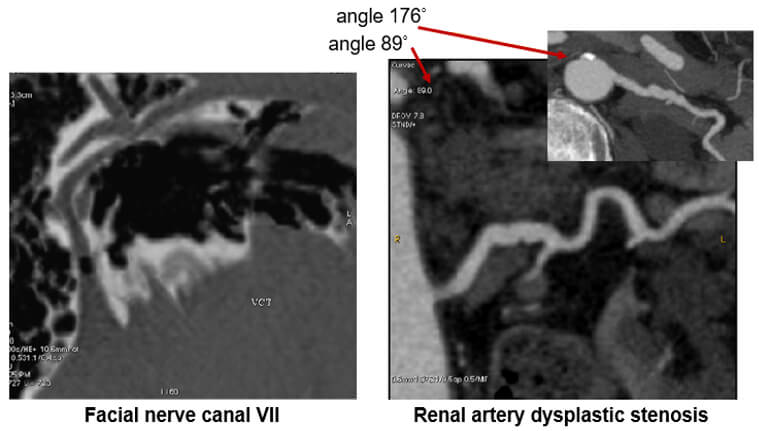
Images
The image on the left shows us the facial nerve while the image on the right shows renal artery dysplastic stenosis.
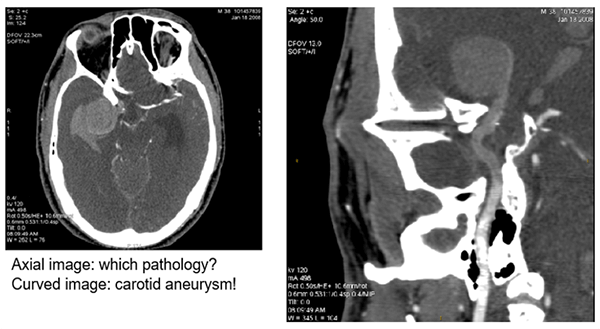
Aneurysm
The image post-processed with a curved technique shows a carotid aneurysm in the upper third of the image on the right.
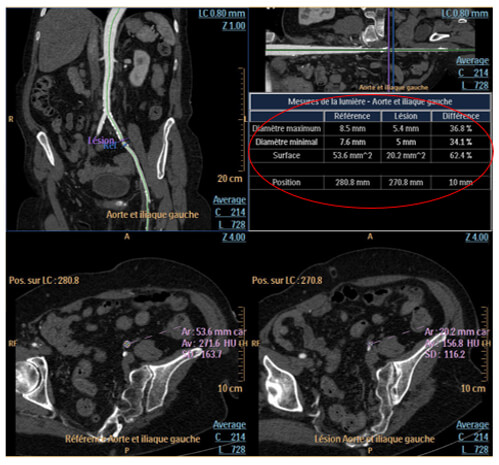
Stenosis Measurement
For stenosis quantification, you have to place the reference on the curvilinear or the stretched vessel image. Once positioned, verify the vessel’s contour for the reference and the lesion.
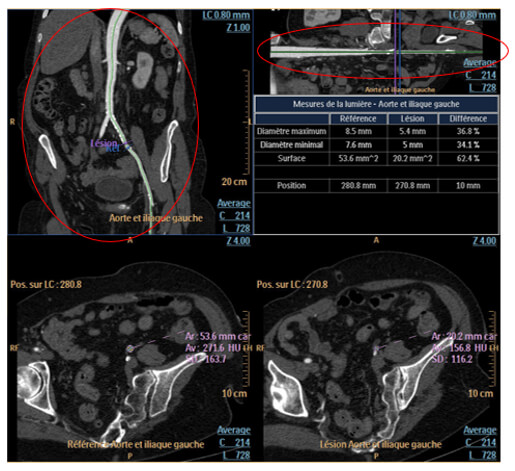
Stenosis Percentages
Stenosis percentages, maximum and minimum diameter and the surface are displayed in the following table.
Endoprosthesis Planning
In this step, you can choose and import the type of prosthesis you want. To do so, you have only to click on the list of prosthesis models and select your choice.
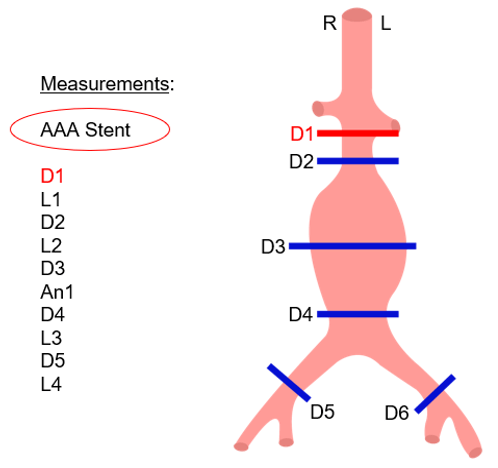
Once the model is selected, you have to adjust the measurements as indicated on the template. For each measurement, check the light contour automatically created by the software.
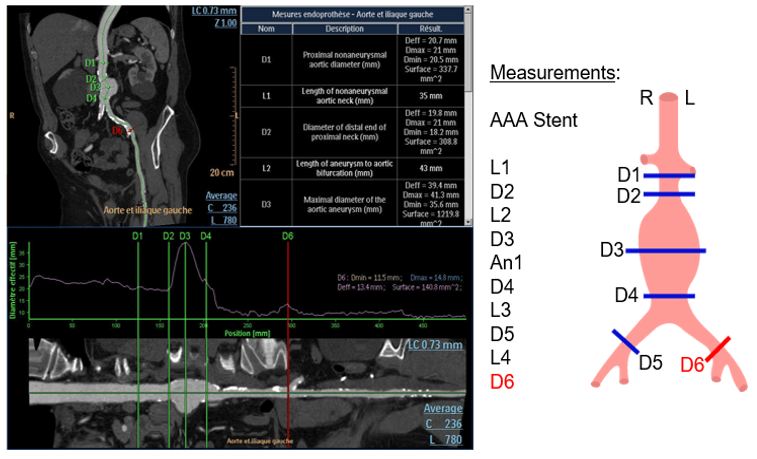
Volume Rendering
Volume rendering (VR) will allow us to use predefined protocols to adjust the amount of opacity and color applied to the model. Then you can display the table of results referring to the necessary measurements for prosthesis fabrication.
Density
Each density range has a very specific opacity coefficient (or transparency coefficient).
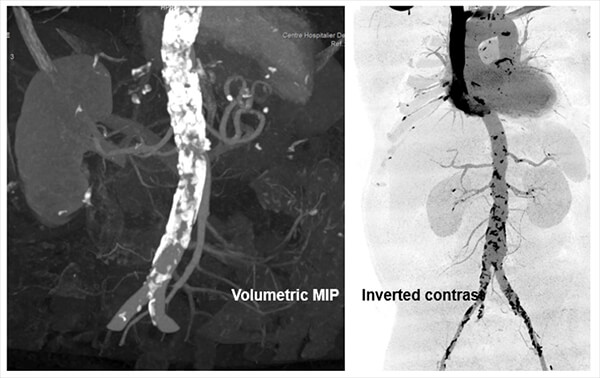
Volume Rendering and MIP
Volumetric MIP and ANGIO
The image on the left is post-processed using a volumetric maximum intensity projection technique.
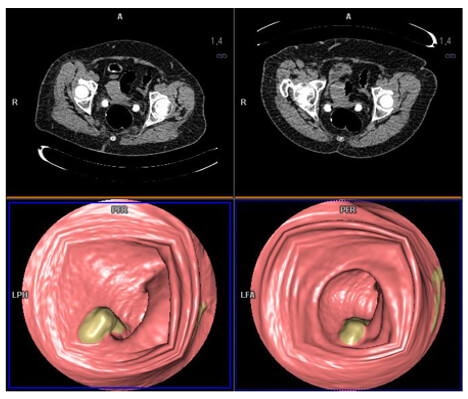
Colonic Endoscopy
The lowest Hounsfield units voxels (near air) have a maximum transparency effect. The voxels with great HU present a significant opacity which materializes the wall of the colon. This is a 3D visualization of the interior of a hollow organ.
Bronchial Endoscopy
Bronchial endoscopy allows the visualization of the bronchial lumen filled with an inhalant object or invasive cancer. This is a 3D visualization of the interior of a hollow organ.
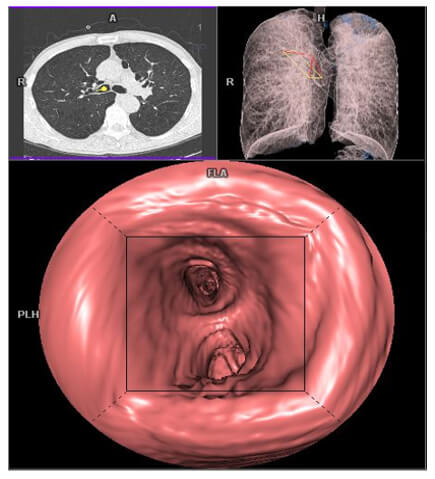
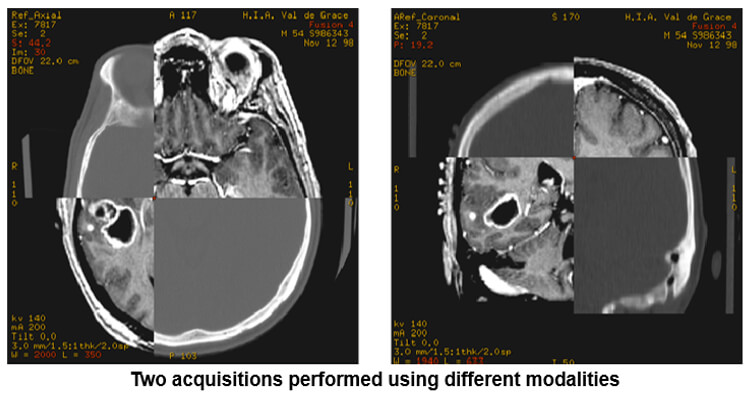
Image Fusion
After fixing three landmarks (or points) in the anatomy, the system readjusts the plans with a maximum tolerance of 20*.
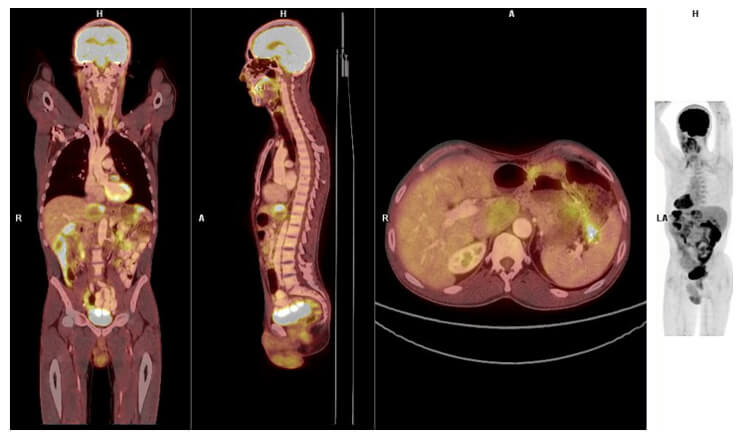
PET CT
A PET/CT combines the nuclear medicine sensitivity with the anatomical location of the CT scanner.
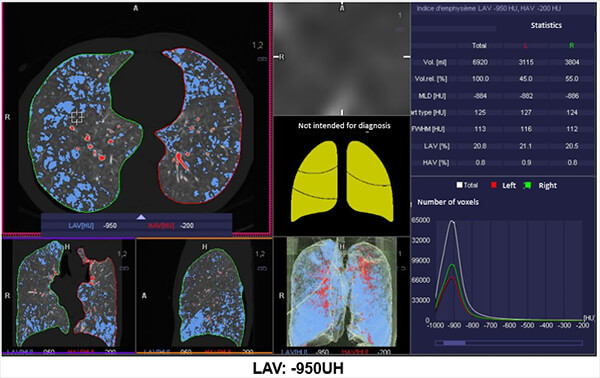
Emphysema Measurement
The automated application called “lung density” provides the physician with quantitative data on the volume of pulmonary emphysema, as well as gives us a visual representation of its diffusion.
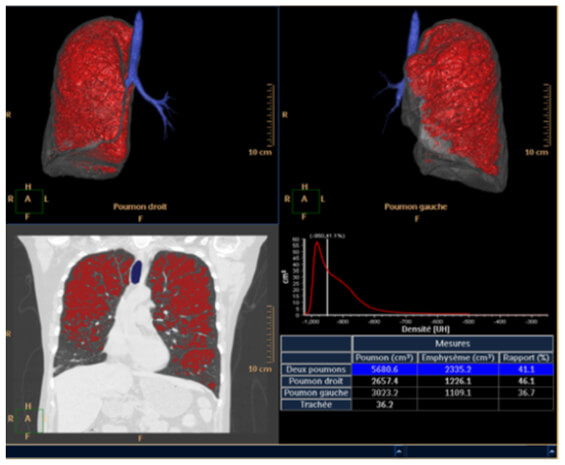
Damaged Alveoli
This image shows us an example of images where the damaged alveoli are highlighted in blue.
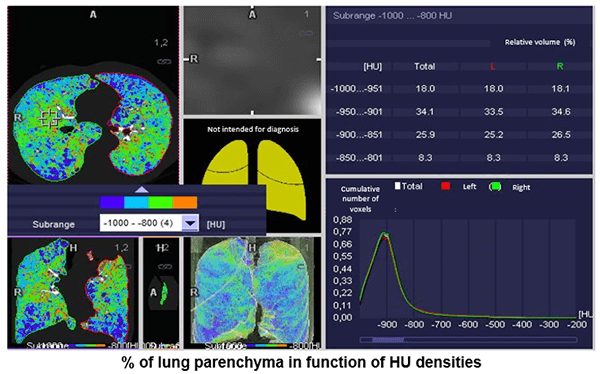
Percentage of Lung Parenchyma
Here, we can see the percentage of lung parenchyma in function of Hounsfield densities.
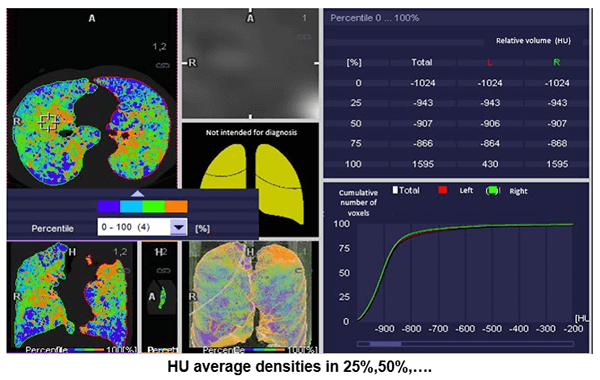
HU Measurements
This image shows the average density measurements in Hounsfield Units of 25%, 50 %, 75%, and 100%.
Post-Test & CE Certificate:
Add to CartPrice: FREE
| ✔ | Approved by the ASRT (American Society of Radiologic Technologists) for 0.25 Category A CE Credits |
| ✔ | License duration: 6 months from purchase date |
| ✔ | Meets the CE requirements of the following states: California, Texas, Florida, Kentucky, Massachusetts, and New Mexico |
| ✔ | Meets the ARRT® CE reporting requirements |
As per the ARRT regulations, you have up to 3 attempts to pass the Post-Test with a minimum score of 75%.
Upon the successful completion of the Post-Test (score 75% or more), you will need to fill up a 1 min survey and then you will be able to issue your CE Certificate immediately.
Refund Policy: Non-Refundable
