Basics of CT Brain Perfusion
Objectives:
- Understand the basic principles of a brain perfusion CT
- Identify the different technical considerations for a Brain perfusion CT
- Know the different perfusion parameters such as CBV, CBF and MTT
- Identify the technical limitations of this technique
- Develop the expertise of the technologists by showing some clinical cases
Description:
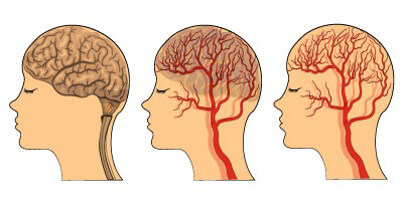
Perfusion Computed Tomography is a noninvasive imaging technique that provides quantitative evaluation of the brain (Cerebral Perfusion), by generating maps of Cerebral Blood Volume (CBV), Cerebral Blood Flow (CBF), and Mean Transit Time (MTT). Brain Perfusion CT is mainly used for the diagnosis of cerebral ischemia, the evaluation of vasospasm, and the assessment of regional perfusion following a severe head trauma. This article is accredited by the ASRT for 1 Category A CE Credit and provides a general overview of Brain Perfusion CT, including image acquisition, data processing, technical limitations, and major clinical applications.
The purpose of this course is to introduce you to brain perfusion CT, how it works, main technical considerations and injection protocols. It highlights the technical limitations and the clinical applications behind this exam.
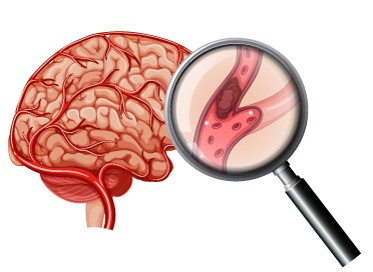
Brain perfusion CT is a Computed Tomography technique that is used to provide detailed information about the blood flow in the brain vessels. This technique is primarily used for clinical diagnosis cases like ischemic stroke, Trauma, brain cancer, and many other diseases.
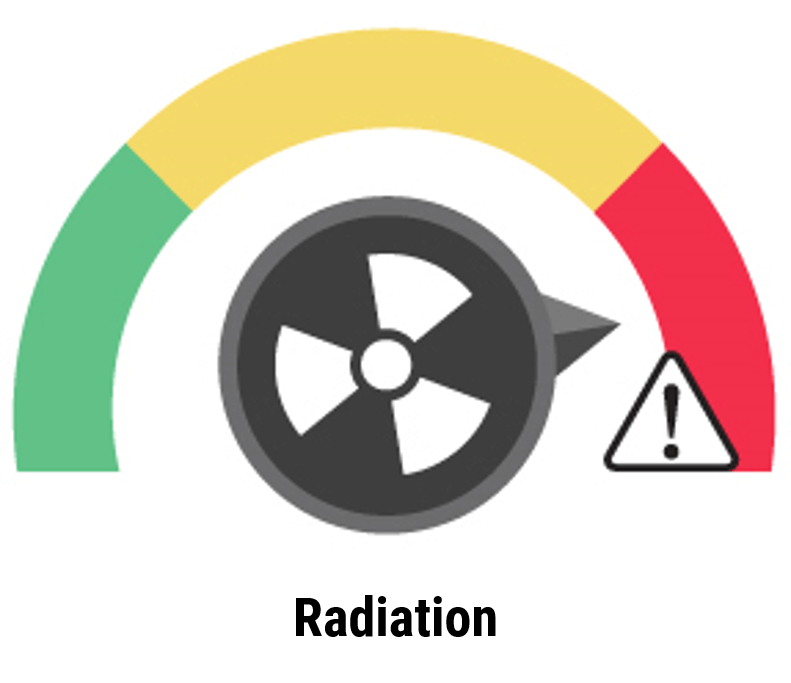
Over the past years, the implementation of new technology has positively affected the performance of the brain perfusion CT exam. At the present time, we are able to acquire a higher resolution and improved coverage of perfusion CT maps at a much lower radiation dose.
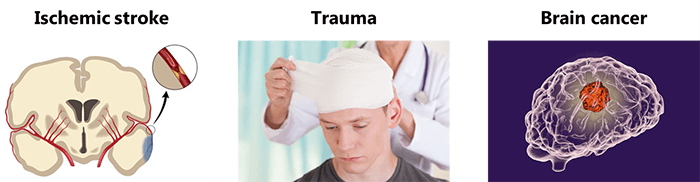
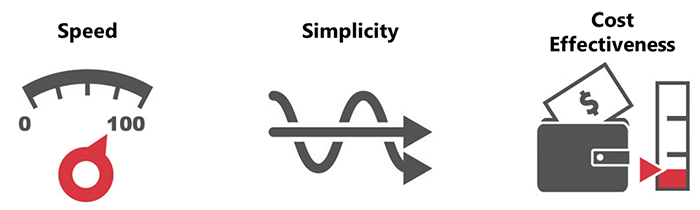
When comparing it to a Brain MRI exam, Brain perfusion CT is a much cheaper and simpler exam, yet it offers the same clinical information with fewer time consumption.
Advantages
Disdvantages
Scan Protocol and Contrast Injection
Before we go any further in that discussion, we need to understand a little more about the technical considerations in use of Perfusion CT. It is important to know how the contrast is injected and the images are acquired to ensure a good image quality and an accurate data calculation.
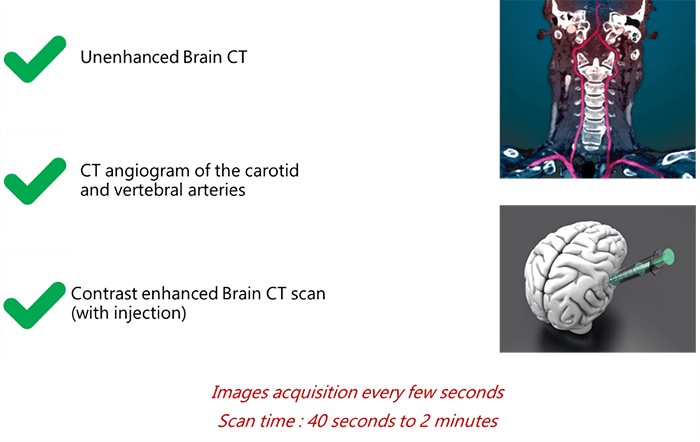
To begin, the scan protocol may be divided into 3 main parts:
- The technologist starts the exam with an unenhanced CT (without contrast injection)
- At this level, a CT angio for the carotids and vertebral arteries is recommended
- After injection of the contrast, a new acquisition of the CT is done where images are acquired every few seconds to see the real-time trajectory of the contrast in the brain vessels
The long acquisition is recommended when the patient presents a cardiac dysfunction narrowing extra-cranial neck vessels.
So how is the contrast media injected into the body?
Iodine-based agent is used in perfusion CT. The technologist injects 20 ml in the patient’s right vein into a peripheral intravenous catheter. The injector rate should be 5-10cc/s with a gauge 18 to 20. To maximize your enhancement and attenuation density, the injection concentration is preferable to be between 300 and 370 mg/ml.
However, you should always take into consideration the high risk associated with contrast injection which is the “Embolization”.
As we mentioned previously, the contrast is generally injected into the right antecubital vein, to reduce the potential risk of contrast pooling and extravasation, and minimize streak artifact at the thoracic inlet during CT angiography.
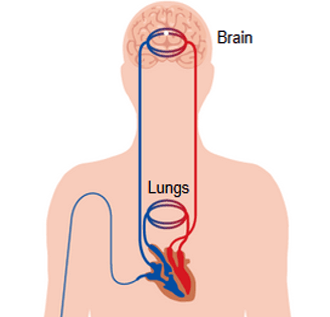
After its injection, the contrast agent travels from the vein through the pulmonary and systemic circulations to the vessels of the brain.
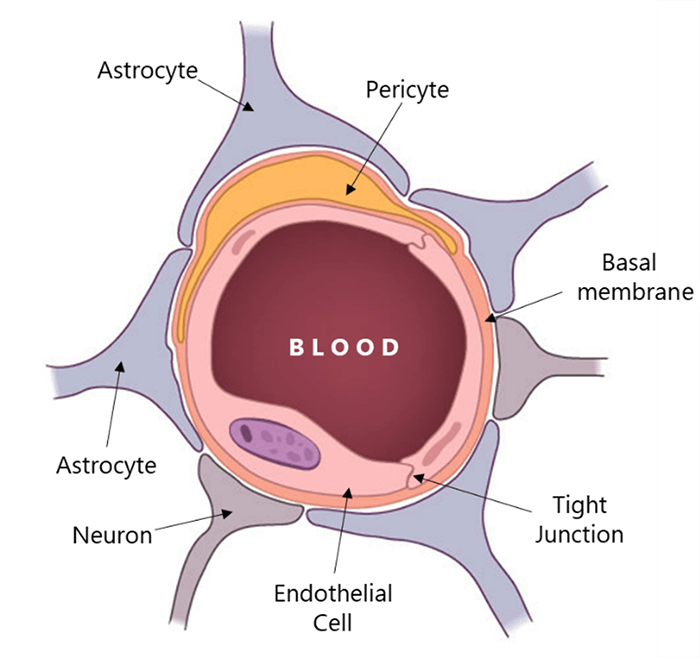
As the iodine-based contrast agents cannot cross the blood-brain barrier, the bolus exits most parts of the brain immediately after its arrival. This can be seen in cine-mode as a pattern of increasing and decreasing x-ray attenuation of each voxel, marking the arrival and departure of the contrast agent.
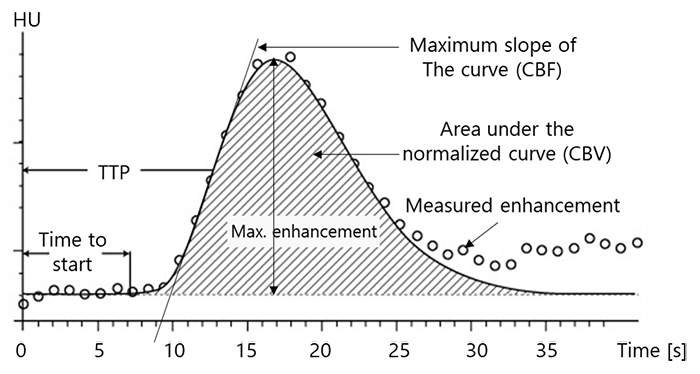
The instantaneous concentration of contrast material within each voxel is calculated by comparing the tissue attenuation at any time point with baseline images obtained before the arrival of the contrast bolus. Combining the measurements drawn from the several time points produces a concentration-versus-time curve (C1) for each voxel. Then a mathematical analysis of C1 for each voxel, generates a number of important parameters of hemodynamic performance, such as CBF, CBV, MTT, and the time-to-peak tissue response.

Acquisition Parameters and Radiation Dose
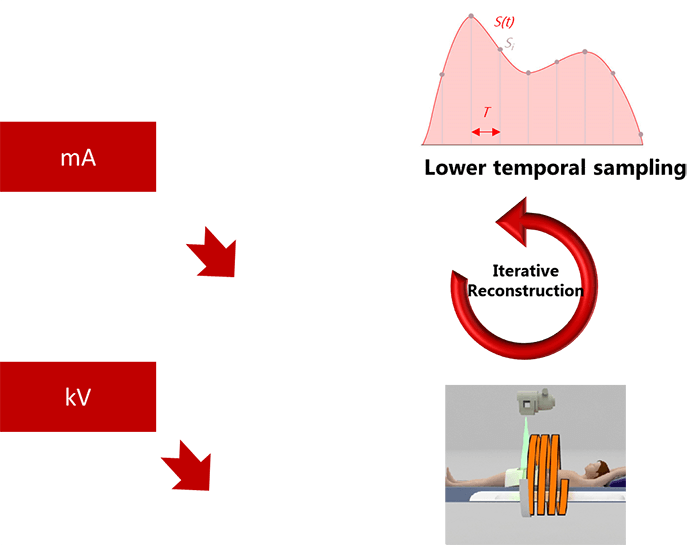
Knowing the fact that the use of CT perfusion imaging is increasing, the need for efficient radiation-reduction strategies is important. In most cases, brain perfusion CT images are acquired with tube currents ranging from 100-200 mAs. This level of radiation produces photons with a mean energy close to the K edge of Iodine, which optimizes the signal-to-noise ratio.
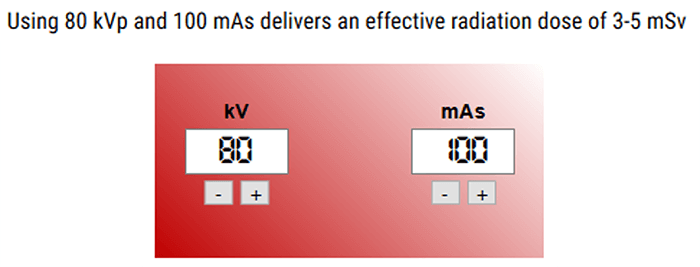
However, with the new technology, a number of strategies have been adopted successfully to lower mA and kV, among which are lower temporal sampling, iterative reconstructions, and increased pitch.
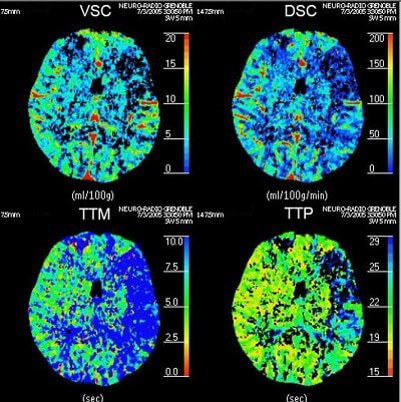
Now that we have a basic understanding of image acquisition in brain perfusion CT, we need to look at 4 essential hemodynamic parameters including: CBV, CBF, MTT and Tmax.
Cerebral Blood Volume (CBV)
The Cerebral Blood Volume CBV, is defined as the volume occupied by intravascular blood in any particular section of brain tissue. It is measured in units of milliliters of blood per 100 g of brain.
Theoretically, any Brain CBV can be calculated in a voxel by adding the contrast concentration measure at each time point of the CT. Thus, if the concentration at time point A in a particular voxel is triple that of time point B in a second voxel, the CBV in voxel 1 is 3 times greater than in voxel 2. However, in real conditions the CBV calculation is not accurate because of the scan short duration.
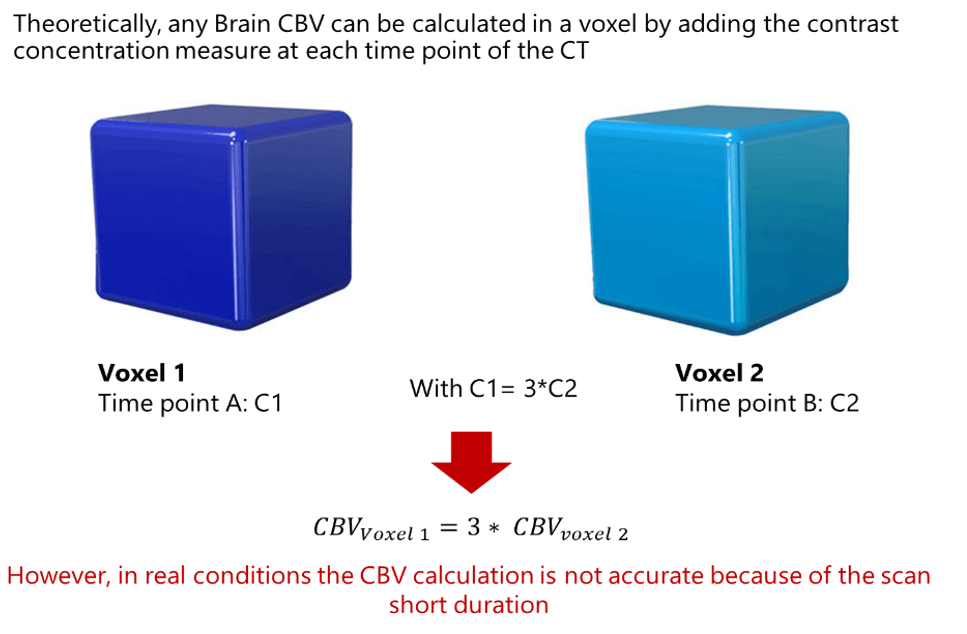
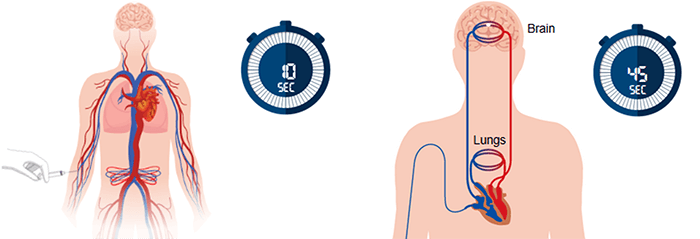
We have mentioned earlier that the CBV calculation is not accurate because of the scan short duration. This is right because a typical perfusion CT requires a contrast injection time of about 10 seconds, followed by only 35 seconds for the bolus to pass from the arm to the brain.
Besides, it is known that some portions of the bolus take a much longer time to reach the brain, thus causing errors in CBV estimation.
An additional cause of error involves the phenomenon of recirculation, which can occur in short-duration scans. Indeed, multiple recirculation passing through the brain may take place during a single perfusion scan, as the initial recirculation of the bolus starts prior to completion of the initial pass. As a consequence, the CBV of any particular voxel may actually measure the summation of multiple passes, overestimating the contrast concentration at that time point.
Underestimation of the tissue concentration can also occur, if the arrival of the bolus is slowed through any or several parts of the brain. Post-processing software, which applies algorithms that overcome the recirculation phenomenon, allows the calculation of regional CBV by integrating the contrast concentration at each of the time points (Ct) over the duration of the scan. Through this approach, scans of longer duration can generate reasonably accurate CBV measurements.
CBV plays an essential role in the assessment of cerebral perfusion disorders.
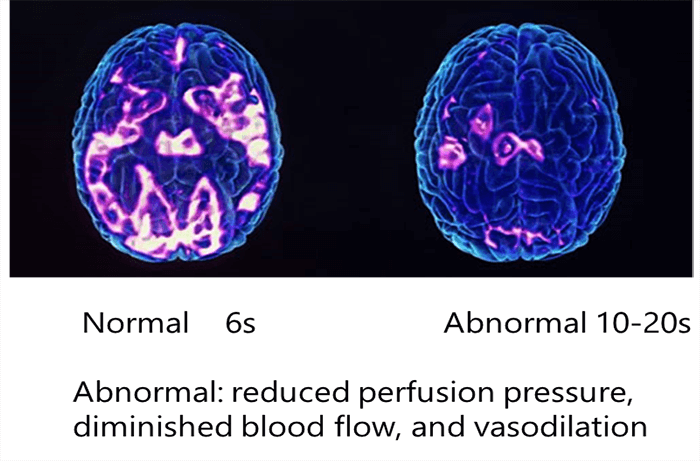
- Auto-regulatory vasodilation produces an increase in regional CBV; the change may be visible in CT perfusion maps and demonstrate reduced perfusion pressure
- Increased CBV stemming from auto-regulatory vasodilation is relatively small, contributing to a bad visualization of the vessels map

Cerebral Blood Flow (CBF)
Moving to the 2nd parameter in brain CT perfusion, the CBF is defined as the volume of blood passing through a given amount of brain tissue per unit of time, most commonly milliliters of blood per minute per 100g of brain tissue.
The 2 major mathematic approaches involved in calculating CBF are the deconvolution and nondeconvolution based methods. These methods are involved in the measurement of the arterial input function (At) and tissue response function (Rt).
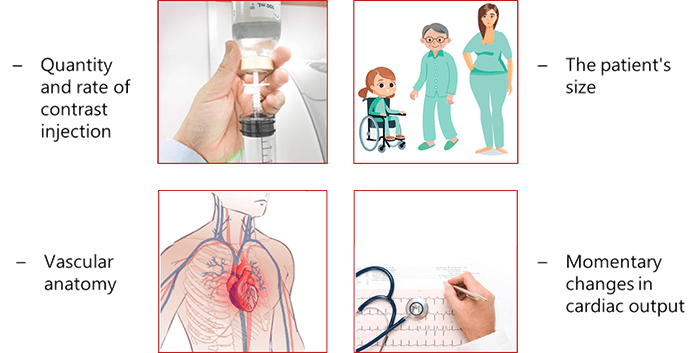
The arterial input function is influenced by the quantity and rate on the contrast injected for the patient, patient size (Child, man and woman), vascular anatomy and the momentary changes in cardiac output.
As a consequence, AIF must be measured in post-processing, with a single At measurement used to represent perfusion calculations for the entire brain. In contrast, Rt, which reflects the amount of contrast that remains in a voxel during the gradual washout period, cannot be observed directly and must be calculated using a mathematical algorithm called convolution.
The CBF is calculated because it determines the tissue viability and the neurologic status in any brain disorder CT as it reflects the rate of oxygen and glucose in the blood.
Mean Transit Time (MTT)
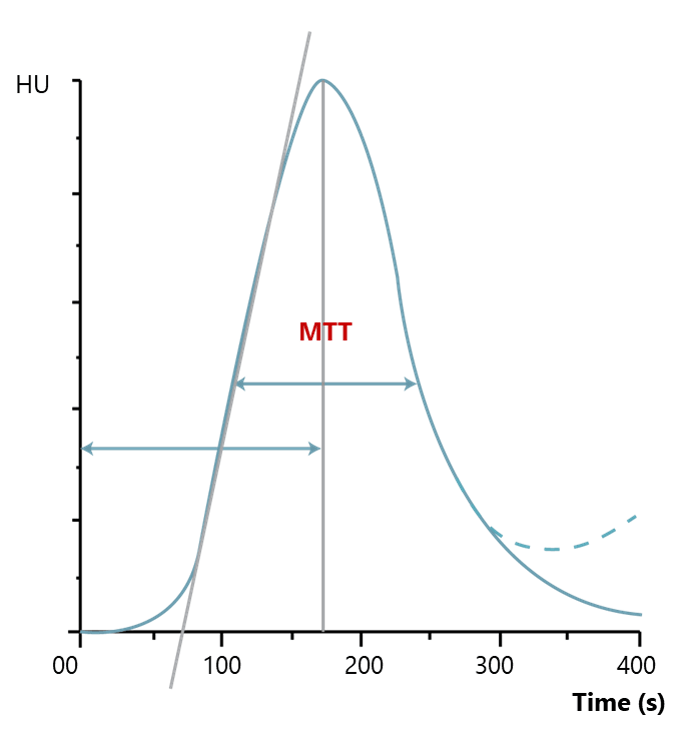
The third main parameter to take into consideration is the Mean Transit Time. MTT is measured in seconds and defined as the average amount of time it takes blood to transit within the blood vessels in a particular region of the brain. In brain imaging, maps of MTT are the most commonly used in clinical situations.
Prolonged MTT value in the context of normal CBF means that the affected tissue could remain in this intermediate state indefinitely without a threat to viability and the appearance of clinical symptoms. Alternatively, if the CBF is low, the integrity of the tissue and the clinical response may be compromised, depending on the severity of the reduction in CBF.
Time to Peak
The last essential parameter used in brain perfusion CT is the time to peak Tmax It is defined as the time at which the contrast bolus achieves maximum amplitude. This measure is calculated in post-processing. The maps that are produced indicate the arrival delay of the bolus in the artery used to derive At, or the time that elapses between AIF and the bolus’ arrival in the voxel in which Tmax is determined.
In practice, Tmax values reflect the time point in which they are sampled. Thus, in a CT perfusion scan where images are acquired every 2 seconds, Tmax maps will have values of 0, 2, and 4 seconds, continuing for the length of the scan.
Normally, the abnormal perfusions are easily detected upon visual Tmax. However, severe perturbations in any hemodynamic parameter are associated with abnormalities. Thus all hemodynamic maps must be considered together to make an accurate determination of the risk to the tissue and the patient.
Now let’s take a look at the Anatomic Coverage limitations, and what Protocol can we use to increase it.
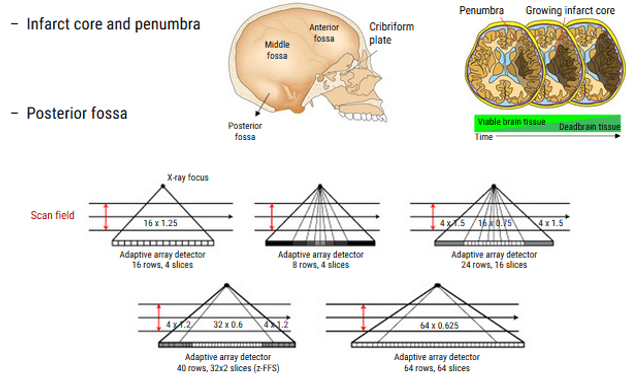
Anatomic Coverage
As we mentioned previously, the diagnosis, characterization, and localization in affected regions of the brain, are limited by the old techniques and the old CT scanner generations especially in these 3 regions: infarct core, penumbra and posterior fossa.
This anatomy coverage and resolution can be decreased by making 2 injections of contrast followed by 2 CT series. Unfortunately, this technique is limited for people who have poor renal function.
Another approach to decreasing coverage, is to move the scanner between two different brain levels, collecting data from each portion in seriatim. This toggle-table technique allows radiologists to capture a substantially greater portion of the brain on CT with a single bolus, although the temporal resolution of the resulting images may be impaired because the time between the sequential images of a single slice is extended. An associated risk of increased contrast and radiation dosage is also seen with these adaptive strategies.
However, the new technology of scanners made a development in perfusion CT. Some of which are the following:
- Higher number of detectors
- Wide Coverage of the region without moving the table and patient
- Radiation safety for the patient: lower exposure
- Better performance for the Perfusion CT Exam
Standardization and Image Processing
Quantification of the region of interest is highly affected by the wide variation in algorithms in Perfusion CT. Some centers use the strategy in using the automated methods, targeting to reduce the staff work and number.
These automated methods will be affected by the software of the machine, institutional methods and the threshold values while for a good diagnosis and ability to choose the right therapy, it’s recommended to optimize protocols.
In this next section, we will discuss some clinical applications where the brain perfusion CT have an essential role in the detection of brain abnormalities and the decision of treating.
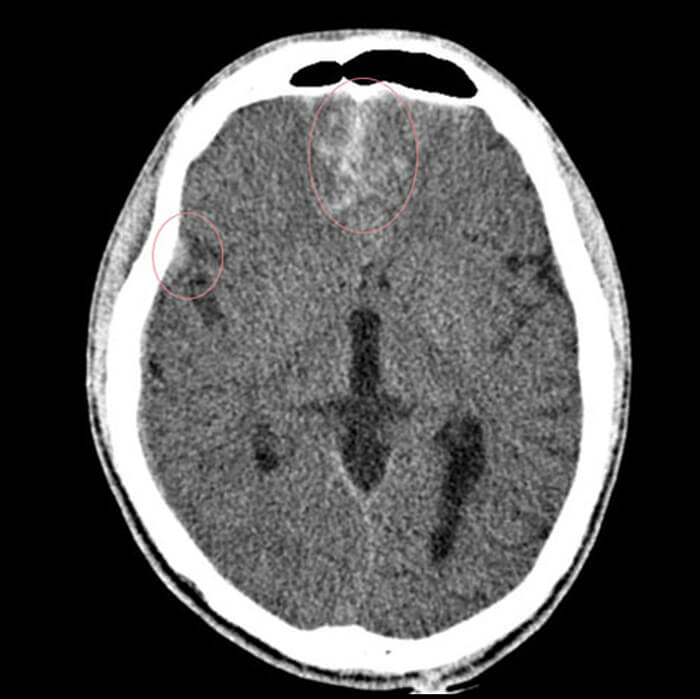
Acute Ischemic Stroke
One of the clinical cases is the Ischemic stroke, characterized by the sudden loss of blood circulation to an area of the brain, resulting in a corresponding loss of neurologic function. Acute ischemic stroke is caused by thrombotic, or embolic occlusion of a cerebral artery leading to mortality and morbidity.
The readily accessible and rapid technique that can help detect any acute ischemic stroke is the Perfusion CT Exa which will evaluate the parenchyma and determine the volume of infarct core and penumbra.
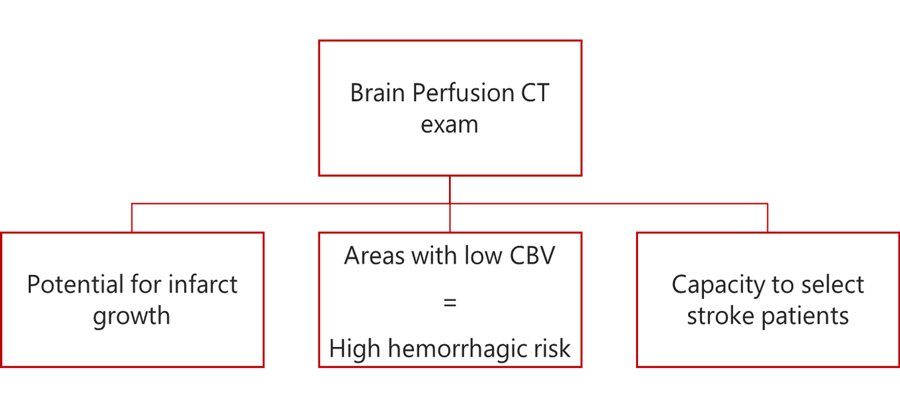
In addition, the Brain Perfusion CT exam will help to reveal 3 things:
- Suggest the potential for infarct growth
- Highlight areas of the brain with low CBV, which will be in high risk for a hemorrhagic transformation following endovascular treatment
- Capacity to select stroke patients likely to benefit from thrombolysis, based on an imaging with no contrast or intracranial hemorrhage
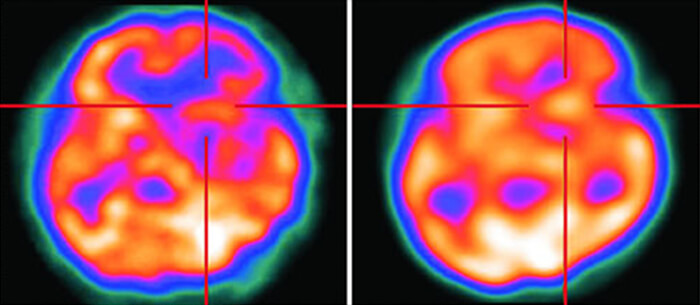
Cerebrovascular Reserve (CVR)
Another clinical application is the Cerebrovascular reserve (CVR) which refers to the capacity of the brain to increase cerebral blood volume (CBV). This vasodilatation is to maintain a constant regional cerebral blood flow (rCBF) in the face of low cerebral perfusion pressure. However, High risk of ischemia from any hemodynamic stress or insult for tissue, leads to losing the ability to quantify the cerebrovascular reserve.
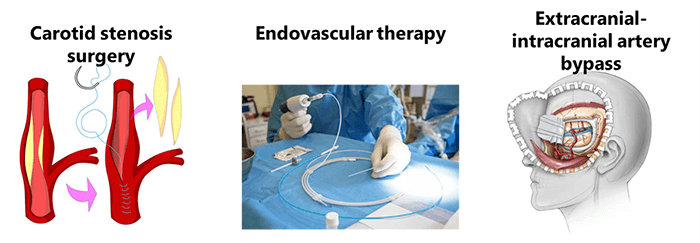
A variety of techniques have been adopted for treatment:
- Carotid stenosis surgery
- Endovascular therapy
- And extracranial intracranial artery bypass
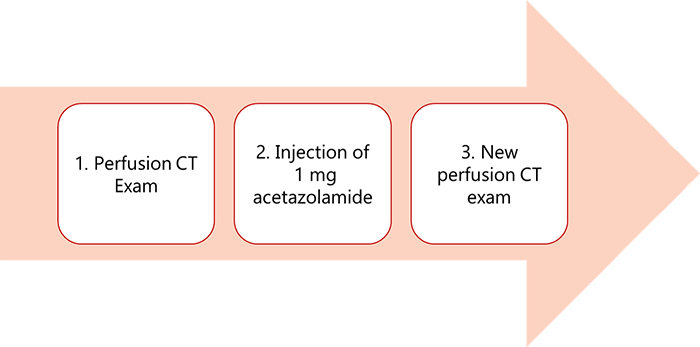
A common approach: Acetazolamide tolerance test is the hemodynamic stress test where you start with a perfusion CT exam then an injection of 1mg of acetazolamide, followed by a new perfusion CT series. The perfusion CT will give a good image quality to detect any abnormal region and the ability to know the values for CBV and MTT.
Vasospasm
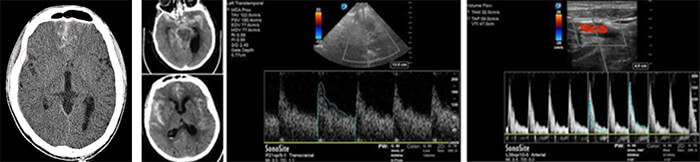
A common complication of aneurysmal subarachnoid hemorrhage (SAH): vasospasm is a significant cause of morbidity early in the disorder’s clinical course. It is defined by a sudden constriction of a blood vessel, reducing its diameter and flow rate. The measurement of the CBF Value is highly important to initially identify this disorder, aid treatment decision-making, and monitor the therapeutic response of patients.
Sonography is the most frequently used method to measure cerebral perfusion in the context of Aneurysmal Subarachnoid Hemorrhage (SAH), unfortunately, this modality is limited by the operator dependency.
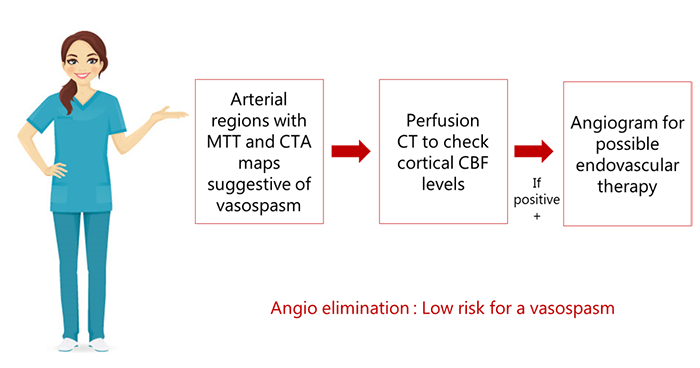
A better approach is to combine perfusion CT with CT angiography to monitor hemodynamics in patients with SAH. On perfusion CT, any arterial territory with prolonged MTT is known to be a potential site for vasospasm.
In cases where arterial regions produce MTT and CTA maps suggestive of vasospasm, cortical CBF levels can be checked via perfusion CT. Patients who are positive can be followed with an angiogram for possible endovascular therapy. This approach is more sensitive and specific than Doppler alone, and presents the advantage of eliminating the need for invasive angiograms.
Head Trauma
Head trauma is one of the cases that CT perfusion can assess. A head injury is any trauma to the scalp, skull, or brain. The injury may be only a minor bump on the skull or a serious brain injury. For assessment, a CT perfusion is recommended which will alert the doctor in cases of early or more aggressive therapeutic choices to prevent intracranial hypertension.
The Perfusion CT in case of Trauma will help in monitoring the disease progression, differentiating between normal and impaired auto regulation and detecting the cerebral contusion altering the brain perfusion.
Oncology
The last clinical application that we will discuss is the case of a brain tumor. A brain tumor is a collection or mass of abnormal cells in your brain. They can be cancerous and malignant or non-cancerous and benign. Glioma is the most common malignant brain tumor which is a mass of abnormal cells that starts in the glial cells of the brain.
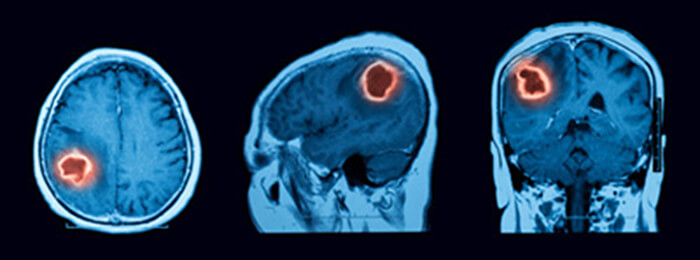
It is known that brain tumors are hyper vascularized, and characterized by a heightened blood Volume and hyper-permeability, thus, a Perfusion CT is performed (with or without a tracer which can provide additional physiologic and hemodynamic information) to provide quantitative information about cancer-related neovascularization that cannot be obtained by conventional imaging.
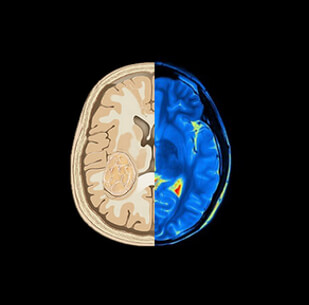
We have previously mentioned that Perfusion CT has an important role in the brain tumor detection and evaluation.
How does Perfusion CT provide information related to tumor growth?
It was proven that microvascular aggression is positively correlated with the aggression of tumors, whereas reduced permeability is associated with diminished tumor growth. This relationship can be demonstrated via perfusion imaging. To evaluate this permeability, microvascular density (MVD), microvascular cellular proliferation (MVCP) and permeability surface PS are measured.
CBF and CBV (perfusion CT measures) are correlated with MDV and MVCP, while PS has been found to be predictive of pathologic grade and well correlated with tumor mitotic activity. These findings suggest that perfusion maps of CBV, CBF, and PS serve radiologists as a means to guide biopsies. In addition, the higher levels of CBF, CBV, and PS may distinguish high-grade (grade III and IV) gliomas from low-grade (grade II) tumors.
Thus perfusion CT can be considered as a noninvasive imaging technique widely used for the evaluation of tumor grading, particularly in the case of high-grade gliomas. In short, perfusion CT has the capacity to provide hemodynamic information that is useful for tumor differentiation, tumor progression, and post treatment response. For many experts, perfusion CT is now considered a preferred imaging choice for brain tumor assessment and management.
Perfusion CT is well recommended and characterized by the easiness, low cost, timesaving, and low radiation exposure for the patient. The new technology is expected to advance into new applications, including seizure disorders and posterior reversible encephalopathy.
Post-Test & CE Certificate:
Add to CartPrice: $4.00
| ✔ | Approved by the ASRT (American Society of Radiologic Technologists) for 1 Category A CE Credit |
| ✔ | License duration: 6 months from purchase date |
| ✔ | Meets the CE requirements of the following states: California, Texas, Florida, Kentucky, Massachusetts, and New Mexico |
| ✔ | Meets the ARRT® CE reporting requirements |
As per the ARRT regulations, you have up to 3 attempts to pass the Post-Test with a minimum score of 75%.
Upon the successful completion of the Post-Test (score 75% or more), you will need to fill up a 1 min survey and then you will be able to issue your CE Certificate immediately.
Refund Policy: Non-Refundable
