
CT Image Acquisition – 0.75 CE Credits
0.75 Category A
$0.00
| Course content | |
| ✔ | Accessible for free |
| ✔ | No credit card required, no registration |
| Post-Test purchase | |
| ✔ | Approved by the ASRT (American Society of Radiologic Technologists) for 2 Category A CE Credits |
| ✔ | License duration: 6 months from purchase date |
| ✔ | Meets the CE requirements of the following states: California, Texas, Florida, Kentucky, Massachusetts, and New Mexico |
| ✔ | Accepted by the Nuclear Medicine Technology Certification Board (NMTCB®) |
| ✔ | Meets ARRT® CE reporting requirements |
| ❌ | Refund Policy: Non-Refundable |
Objectives
- Understand the process of data acquisition
- Discuss acquisition modes and parameters
- Define CT Dose Index (CTDI)
Description
The formation of CT images involves many steps: Data acquisition is the first of these steps. The term data acquisition refers to the collection of the measurements of x-ray transmission from the patient. After these x-rays have passed through the patient, they land onto special electronic detectors that measure the attenuation values. Enough of these data must be recorded to meet the requirements of the reconstruction process being used. In this article, acquisition modes and parameters, dosimetrix indexes and dose reference level will be discussed. This article is accredited by the ASRT for 0.75 Category A CE Credits.
| «« CHAPTER 1«« CHAPTER 2«« CHAPTER 3 | CHAPTER 2 »»CHAPTER 3 »»CHAPTER 4 »» |
CHAPTER 1
Acquisition Modes
The formation of CT images involves many steps. Data acquisition is the first of these steps. The term data acquisition refers to the collection of the measurements of x-ray transmission from the patient. After these x-rays have passed through the patient, they land onto special electronic detectors that measure the attenuation values. Enough of these data must be recorded to meet the requirements of the reconstruction process being used.
Scout View or Topogram
Three main methods will be explained in detail, the minimum intensity projection, the average intensity projection, and the maximum intensity projection.
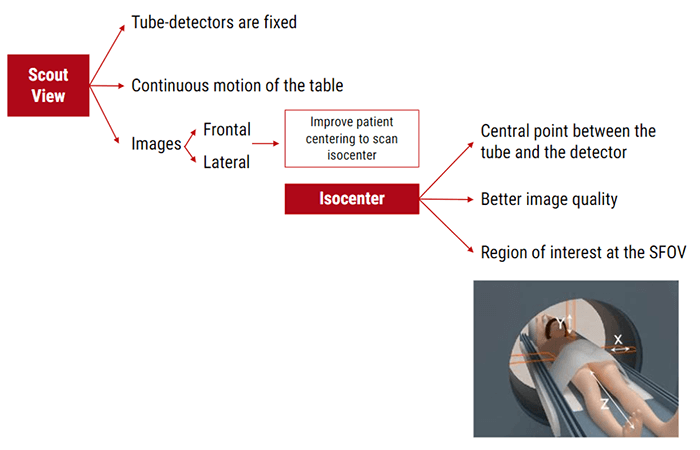
A scout image is a low dose digital radiograph formed from a linear scan and taken as the table moves through the gantry with the x-ray tube stationary, for example at 0 degrees or 90 degrees.
Using information from an initial scout view, the scan mA value is individually adjusted depending on the position for each tube rotation. An enhanced version of mA modulation available on some scanners allows mA adjustment not only for each rotation but also as a function of angle during each rotation.
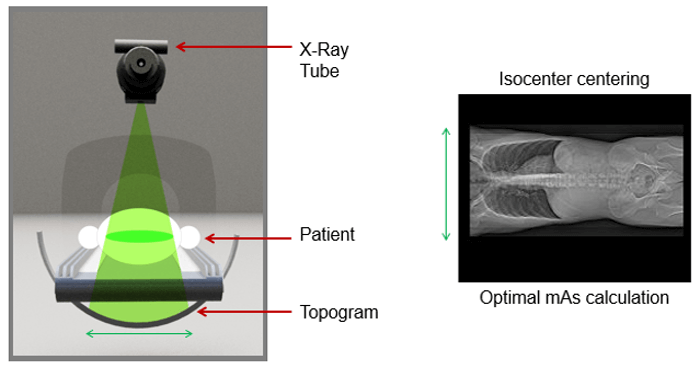
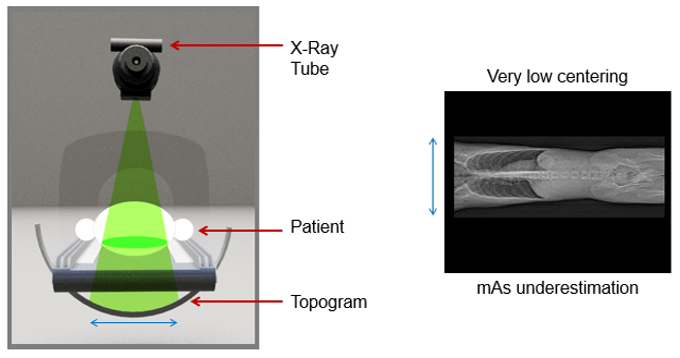
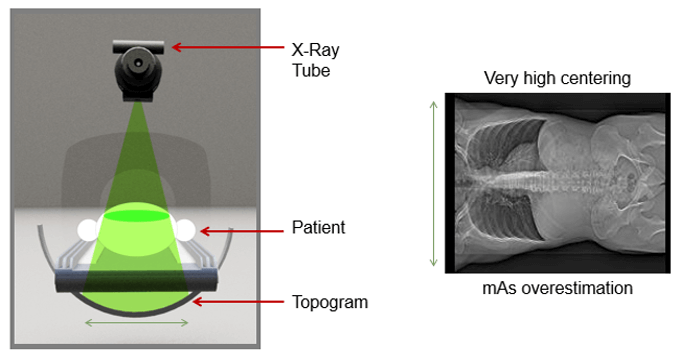
Any vertical or horizontal deviation in patient centering with respect to gantry isocenter, (the point in space through which the central rays of the radiation beams pass), leads to overestimation or underestimation of attenuation. This can result in the erroneous estimation of tube current with the automatic exposure control technique.
This shows an example of very high centering with a resultant mAs overestimation.
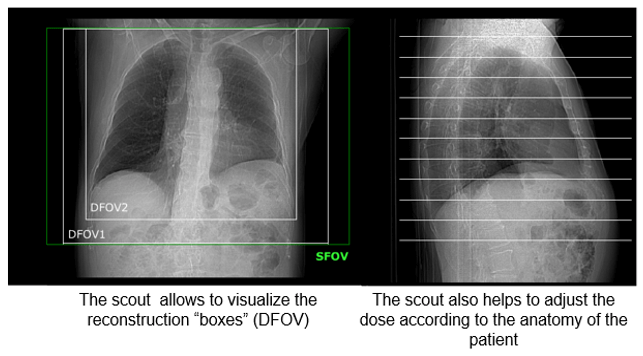
The scout view allows the visualization of the displayed field of view (DFOV) and the adjustment of the dose according to the patient’’s anatomy.
SFOV and DFOV
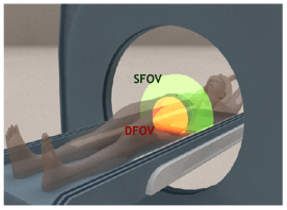
The SFOV, or scan field of view, is the diameter of the circular region within the scanned plane over which projection data is collected. It is nominally equal to the diameter of the primary beam in the axial plane. This is chosen by the technologists and depends on the anatomy being studied.
DFOV, or display field of view, can be equal to or less than the SFOV. The display field of view determines how much of the scan field of view is reconstructed into an image. Note that The DFOV can be as wide as the SFOV. The DFOV is used to target a specific organ.
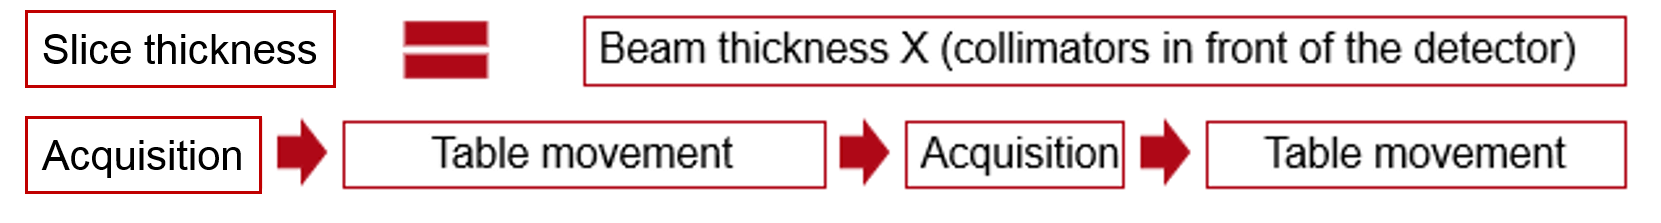
Conventional Acquisition
Before the introduction of spiral CT, the CT scan consisted of a rotation around the stationary object followed by the translation of the patient by one slice thickness… This scan mode is called conventional or step and shoot CT.
With a slice to slice scan, the table does not move during the acquisition. Therefore you get an acquisition, then table movement, then acquisition, then table movement until the desired length of anatomy is covered.
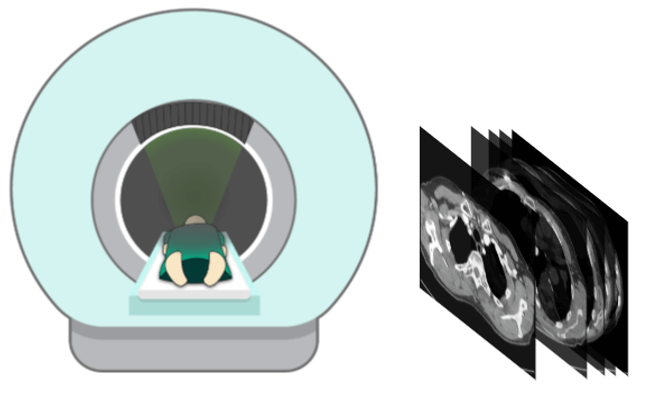
Helical Acquisition
With helical scanning, the table moves with the patient continuously through the gantry as the x-ray tube detector assembly continuously rotates. Unlike conventional CT, helical CT provides continuous volumetric acquisition as the patient moves through the gantry.
CHAPTER 2
Acquisition Parameters
kVp
As you remember, kVp is the component that controls the quality of the x-ray beam. It is also what controls the contrast or grayscale in the image. The higher the kVp, the lower the contrast, giving us many shades of gray. The lower the kVp, the higher the contrast, or more black to white. This is needed for bone studies.
mA
An mA is a unit of measurement or the controlling factor of the number of photons produced or the quantity of x-rays. The overall exposure of the images is controlled by mAs.
Review the examples of the overexposed and underexposed images. The example of an underexposed image illustrates the quantum mottle caused by a low number of X-ray photons to the detector and corresponding low dose to the patient. However, depending on the diagnostic need, there may not be adequate image quality to make a diagnosis.
Pitch
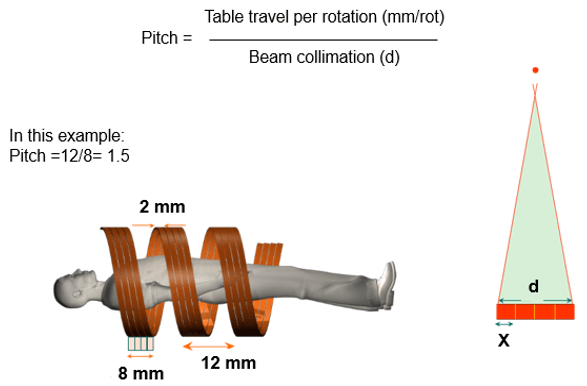
Definition
A pitch is defined by the table travel per rotation divided by the beam collimation in diameter. For example, if the table traveled 5 mm in one rotation and the beam collimation was 5 mm then pitch equals 5 mm / 5 mm = 1.0. The choice of pitch affects both image quality and patient dose.
In a multislice CT, the beam pitch is defined as table distance traveled in one 360° gantry rotation divided by the total thickness of all simultaneously acquired slices.
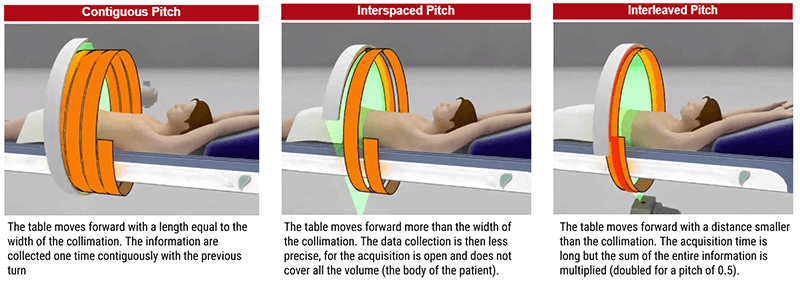
Types
These are the difference between the three types of pitch, contiguous, interleaved and interspaced.
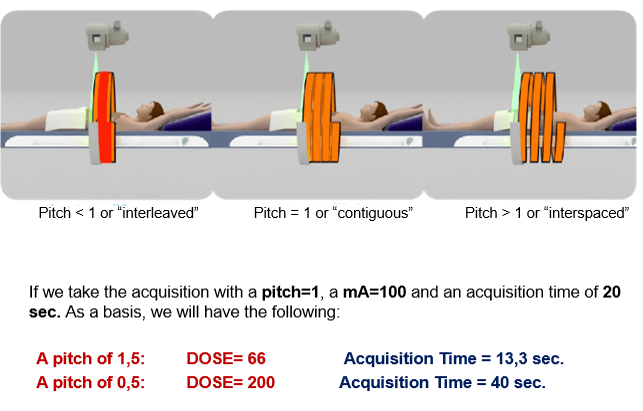
As shown in this image, higher pitch reduces image quality and reduces patient dose and lower pitch increases image quality but increases the patient dose. For example, a pitch of 0.5 will produce a good quality image but increases the patient dose substantially.
Rotation Speed
When we increase the rotation speed of the detectors, the acquisition time is reduced but the image becomes noisier. This is due to the system’s ability to correct the maximum information per second. To reduce the acquisition time for emergency protocols, the persistence of the detectors should be as short as possible.
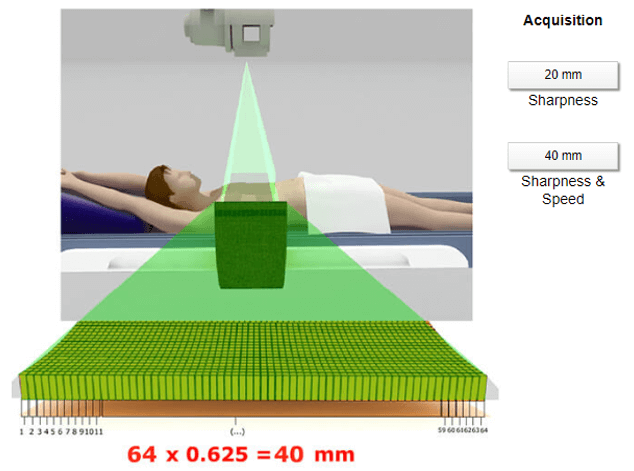
Collimation Acquisition
There is better recovery due to larger detector collimation. Collimation affects total scan time, noise and thinnest reconstruction. 16 slices means that for one rotation, the system produces 16 images. The detectors constitute the mechanical part that produces the images.
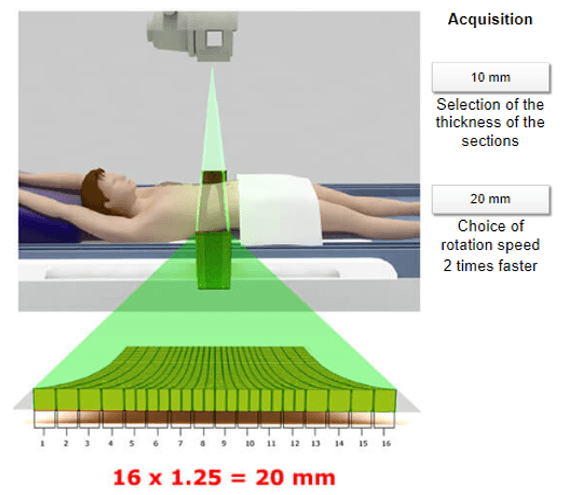
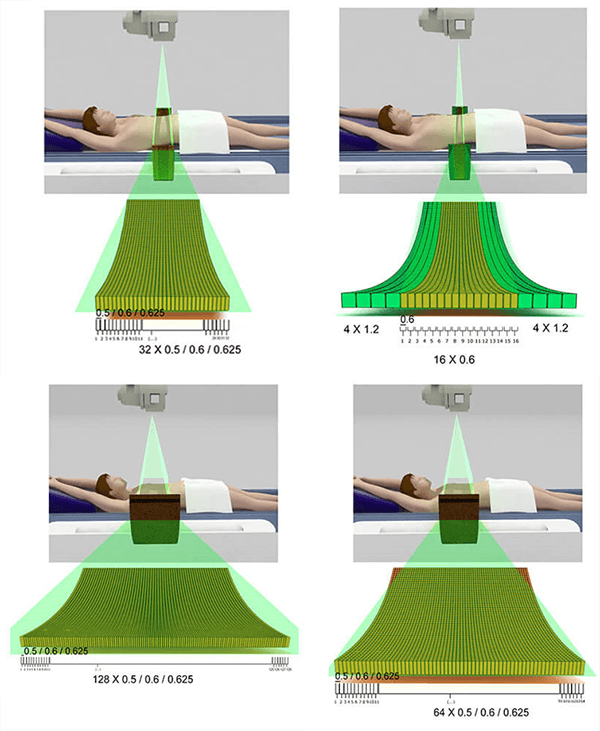
This example depicts two possible choices – 32 or 64 slices. Using the same size of detectors but a different choice of collimation will result in different acquisition times. View the 20mm and 40 mm icons to see the difference.
Two types of detector elements exist. Symmetric where the thickness of the detectors are the same width, and asymmetric where the thickness of the detectors are the same in the center but thicker at the edges. This shows the different designs for 256 and 320 detectors.
Cerebral Perfusion
Mandibular Dislocation
CHAPTER 3
Dosimetric Indexes
Measurement of CTDI
Computed Tomography Dose Index or CTDI is a standardized measure of radiation dose output of a CT scanner. This allows the user to compare the radiation output of different CT scanners. This is determined by a reference dose of phantoms.
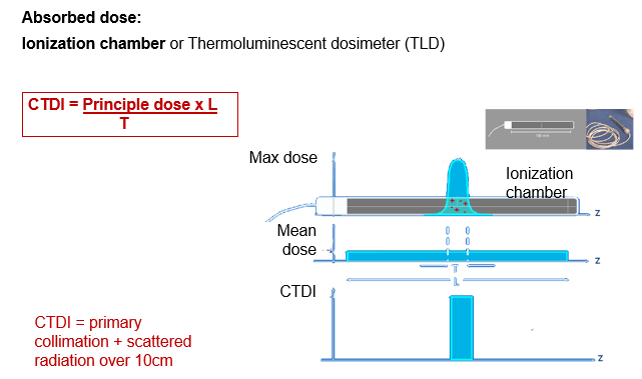
Dose index (CTDI: Computed Tomography Dose Index): Defined primarily to allow a comparison between mono barrettes and that which indicates the absorbed dose delivered to a value of 100 mAs.
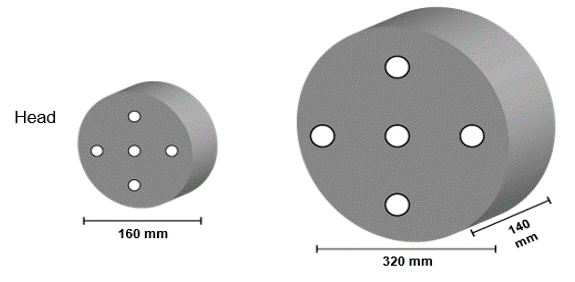
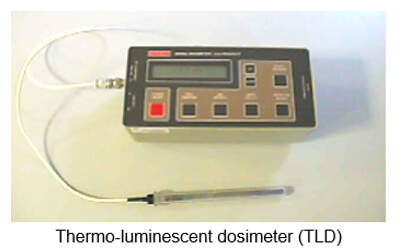
For the measurement of CTDI, two Plexiglas phantoms are used. A 16 cm skull and a 32 cm body phantom. The central and peripheral dose is measured with an ionization chamber or a Thermo-luminescent dosimeter or TLD. This can also take into consideration the primary and scattered radiation.
CTDI
Ionization Chamber or TLD
The CTDI is the dose-related to a single slice. It is calculated along the rotation axis (z) of the CT scanner and divided by nominal slice thickness (T). The FDA issued its formal regulatory definition in the Federal Register of August 31, 1984, but advances in CT technology, practice, and radiation dosimetry have outpaced the accuracy of this quantity as an indicator of actual radiation dose and have weakened its relevance to clinical dose in patients. In theory, the quantity CTDI is an index that provides only an indication of the magnitude of doses that would be delivered to patients and of the changes in doses as a function of CT scanner model and conditions of operation.
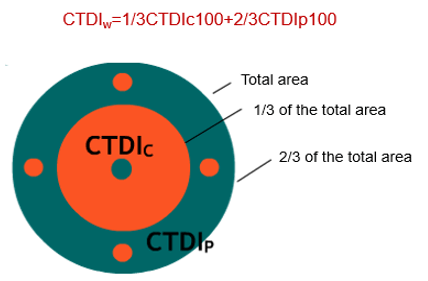
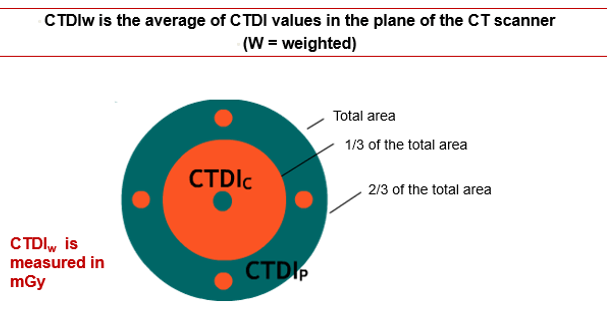
CTDIw (Weighted)
Why do we have to use an entire CT scan to measure the dose to one slice? Well, many x-rays scatter into the patient’s body – so a good amount of dose to one slice is deposited in adjacent slices. Also, remember that the dose is not uniform from the surface to the inside of the body – the superficial tissues absorb more of the dose, and less radiation reaches the center of the body. Because the CT tube circles the body 360 degrees, this is symmetric* around the body. The CTDI 100 protocol is calculated for a length of 100 mm without considering slice thickness.
CTDIw is closer to the human dose profile as compared with the CTDI100, which does not take into consideration the topographical variation of a human body. We can convert CTDIw (=CTDI100) to helical mode, and this is called the volume CTDI, or CTDIvol. For helical scanners in current use, the parameter CTDIv, or volume, is the more commonly used index.
Each phantom is exposed only once. The ionization chamber conducts one measurement of dose + scattered radiation over 100 mm.
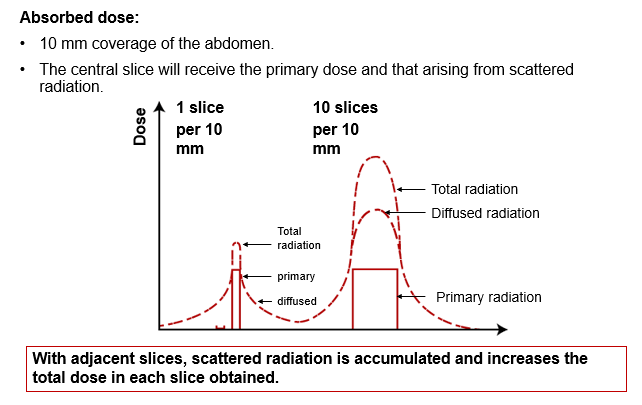
Role of Scattered Radiation
The tissue in the central slice will receive both the primary dose and the scatter radiation. It will also receive the scattered radiation from slices 4 and 6 and to a lesser proportion from slices 3 and 7. The adjacent slices will have an increased total dose since the scatter radiation is accumulated. Notice the total radiation dose in each.
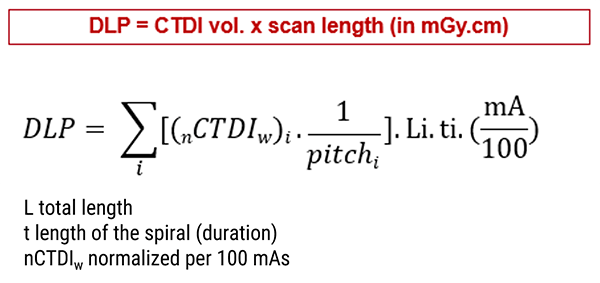
CTDIvol
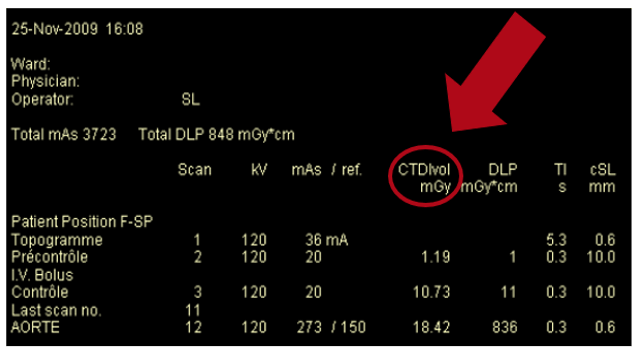
The CTDIvol is obtained by dividing CTDIw by the pitch factor. It is important to remember that the CTDIvol or its derivative the DLP, as seen on consoles and outputted on the DICOM images, does not represent the actual absorbed or effective dose for the patient. They are taken as an index of radiation output by the system for comparison purposes.
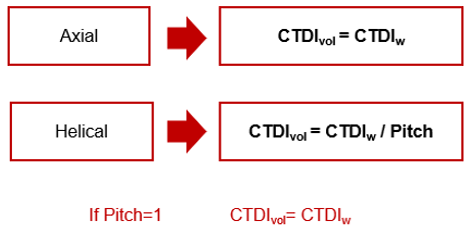
Axial and Helical
In Helical scanning, the volume CT dose index is defined as the weighted CTDI divided by the beam pitch factor. In the Axial, volume CTDI is equal to the weighted CTDI. This dose is expressed in milliGrays.
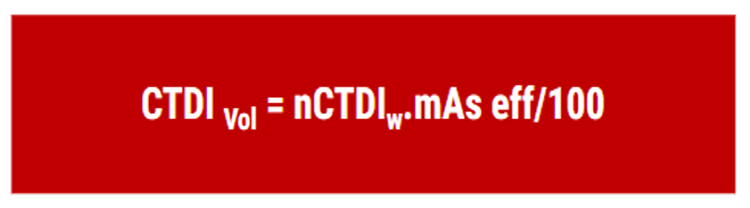
mAs
Currently, the modulation of mAs introduces the concept of effective mAs. This quantity represents the average value of mAs delivered during the acquisition. Volume CTDI represents the average absorbed radiation dose over the x, y, and z-axis.
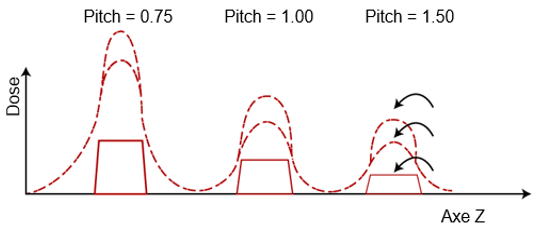
Pitch Variation
For the same mAs and kV values:
- A pitch of 0.75 increases the dose around 33%
- A pitch of 1.5 decreases the dose around 66%
DLP
Dose Length Product
The DLP, dose length product, is the measure of the total radiation exposure for the whole series of images. It is related to the volume CTDI but instead of the measurement of a single slice, it measures the entire length of the scan.
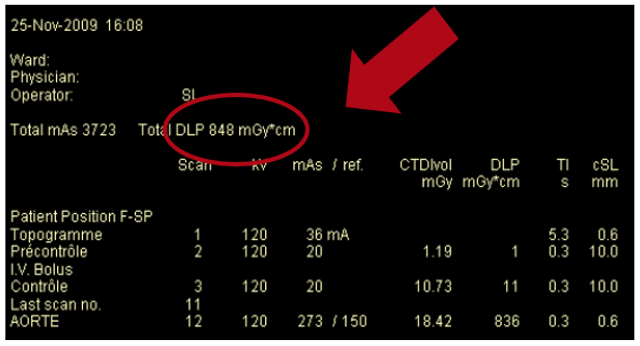
The DLP was created out of the necessity of having a size for clinical use. It is an indicator of the dose delivered to the examination that is easily understood by users, encompassing all the factors involved in quantifying dose by the scanner.
DLP does not take the size of the patient into account and is not a measure of absorbed dose. It is important to remember that DLP is not the patient’s effective dose. The effective dose depends on other factors including patient size and the region of the body being scanned. Some factors have been estimated to convert DLPs into effective doses, depending on the body region. The DLP is expressed in mGy.cm.It is the CTDIvol multiplied by the length examined.
CHAPTER 4
Dose Reference Level
Diagnostic reference levels (DRLs) are benchmarks for radiation protection and optimization of patient imaging. They were first mentioned by the International Commission on Radiological Protection (ICRP) in 1990 and were clarified further in 1996. The ICRP defines two key elements in medicine: justification and optimization of radiology examinations. Justification implies that the examination is indicated and the patient’s benefit exceeds any potential detriments. Optimization implies that radiation exposure is optimized for the clinical purpose of the examination.
The Dose Reference Level (DRL) is the value of the 75th percentile of the doses measured for a given examination for a large number of patients. DRLs should be set for representative examinations or procedures performed in the local area, country or region where they are applied.
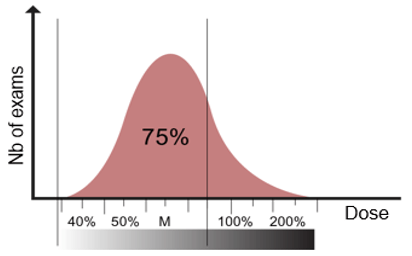
The dose distribution curve is to be representative of radiological practice in a country.
Phantom-Based DRLs and ADs for Adult and Pediatric CT (CTDIvol)
National DRLs (NDRLs) should be set based on wide-scale surveys of the median doses representing typical practice for a patient group (e.g. adults or children of different sizes) at a range of representative healthcare facilities for a specific type of examination or procedure.
https://www.acr.org/-/media/ACR/Files/Practice-Parameters/Diag-Ref-Levels.pdf
