Ultrasound Physics
Objectives:
- Understand ultrasound Basic Physics
- Introduce the principle of image formation, resolution and artifacts in sonography
- Introduce the Doppler effect and the ultrasonic velocimetry
- Understand the physical principle behind harmonic imaging
Description:
Physics of Ultrasound Imaging made simple and easy to understand. Master the basics and fundamentals of the U/S before you surf deeper into its clinical applications. Topics include: the basic principles (piezoelectric effect, probes, and ultrasound propagation), ultrasound image formation, U/S image resolution and artifacts, difference between continuous wave and pulsed Doppler, Color Doppler and Tissue Harmonic Imaging. This article is accredited by the ASRT for 1 Category A CE Credit.
Ultrasound is an acoustic sound in the form of waves, having a frequency above the human hearing range. Animals such as bats, use ultrasound for locating obstacles. Humans use ultrasonic devices to detect objects and measure distances. Ultrasound imaging has been used in medicine since 1942.

Ultrasound in Medicine & Biology
The ultrasound is a frequently used modality in different medical specialties. For instance, ultrasound is widely used by obstetricians, radiologists, and cardiologists. Moreover, it is also deployed in neurology, ophthalmology and other specialties as well.

Moreover, ultrasound is used in diagnostic applications such as tissue characterization and velocimetry. It plays a therapeutic role in lithotripsy and hyperthermia.
Definition and Characteristics of Ultrasound Imaging
An ultrasound is a mechanical wave that requires an initial energy input to be created. The wave travels through the medium until all its energy is transferred. It is important to note that ultrasound is not different from the normal or audible sound in its physical properties, except that it is of high frequency and cannot be heard by humans.
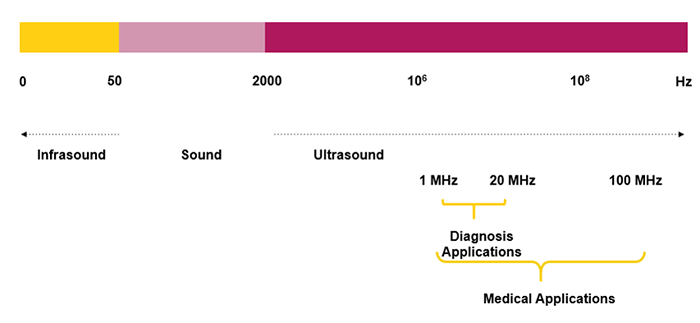
The human ear is not sensitive to ultrasonic vibrations:
- Audible Sound: 20 Hz < F < 20 kHz
- Ultrasound: 20 kHz < F < 200 MHz
- Ultrasound for Diagnosis: 2-20 MHz
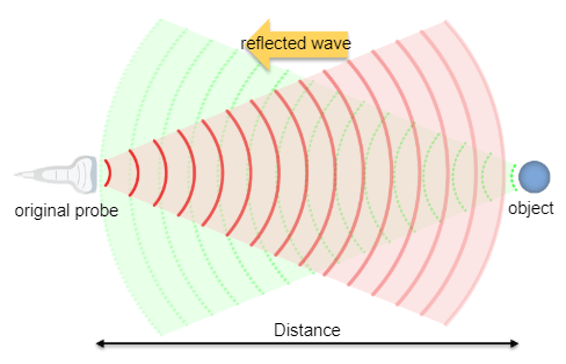
In Ultrasound, the transducer emits high-frequency sound waves. These waves, as they propagate through organs, will be reflected then processed and analyzed to create the image.
Physical Principles of Ultrasound
However, a sound wave, propagated in the air, will reflect each time it collides with a solid surface. This thoughtful sound is called an echo. The same applies to ultrasonic waves that propagate through organs and run into an obstacle.
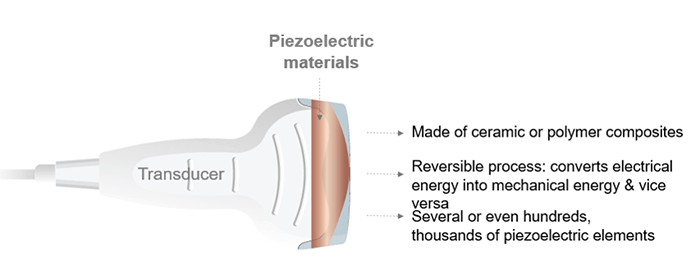
Piezoelectric materials are made of ceramic or polymer composites characterized by the reversible process, which converts the mechanical energy into electrical energy and vice versa. A transducer is composed of several or even hundreds or thousands of piezoelectric elements.
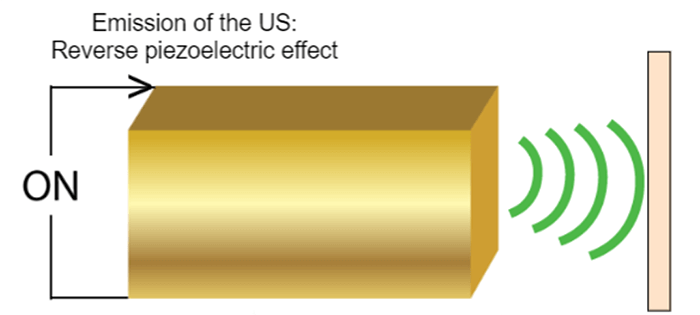
Reverse Effect
What is the difference between reverse and direct effect? And how do Piezoelectric Elements Generate Ultrasound?
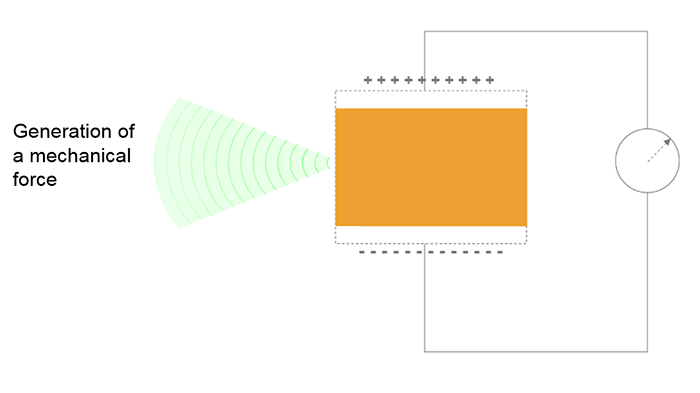
The reverse effect is defined as the generation of a mechanical wave resulting from the application of an electric field. When an electric field is applied, the charge carriers are shifted in the piezoelectric materials, leading to a macroscopic change in the length of the material (inverse piezoelectric effect), thus to the emission of the ultrasound wave. The resulting sound waves propagate in the surrounding medium, where their speed varies according to the density and the elastic properties of the medium.
Direct Effect
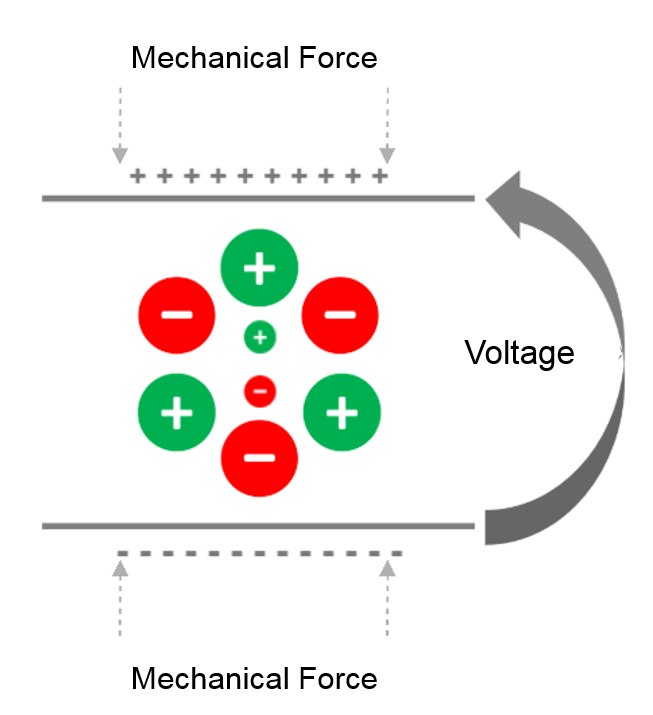
The direct effect is the generation of an electrical signal following the application of a mechanical force. The piezoelectric effect converts the mechanical energy (received ultrasound wave), into electrical energy, due to the crystal deformation. This is how ultrasound transducers receive the sound waves.
Principle of Piezoelectricity
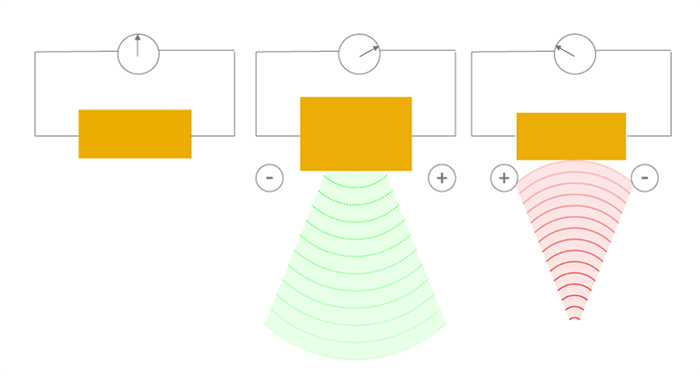
It is known that the crystals in the ultrasonic probe change shape, and emit ultrasonic waves when stimulated by an electrical current. These sound waves reflect off the surface of the body and collide with quartz crystals, which then produce an electrical current.
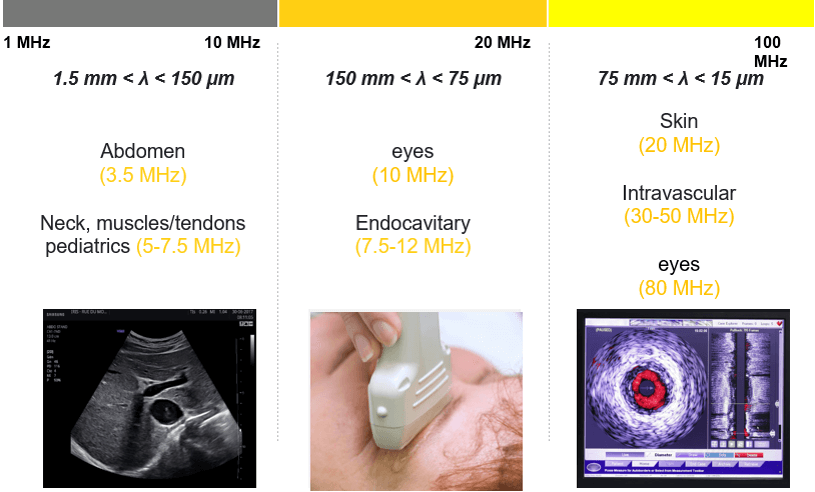
Frequency Scale
Here you can find the frequency scale of infrasound, audible sound, ultrasound, and the range of frequency used for the medical applications. As you can see, ultrasound waves are sound waves with frequencies higher than the upper audible limit of human hearing. The frequencies used for medical imaging are generally in the range of 1 to 20 MegaHertz.
General Aspect
A common approach, any ultrasound transducer has the same role as an ear or mouth; it sends and receives ultrasound waves. The transducer is the hand part of the machine, responsible for the ultrasound production and detection. It converts the electrical energy into mechanical energy and vice versa, based on the piezoelectric effect.

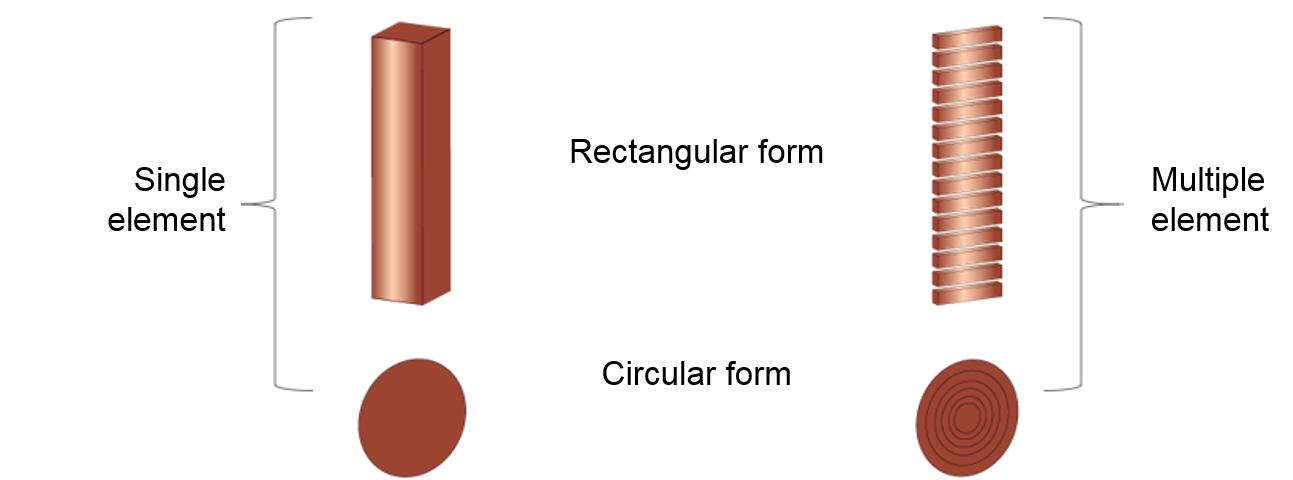
As we mentioned previously, the ultrasound transducer is composed of one or more crystals called piezoelectric crystals. It might be composed of a single element or a band of multiple elements in rectangular or circular form. Besides, the element thickness is determined based on what resonance frequency is desired. Multi-element ultrasound transducers have the advantage that the ultrasound beam can be steered and focused electronically without moving the transducer by using electronic/digital delays in the activation of the different piezoelectric elements.
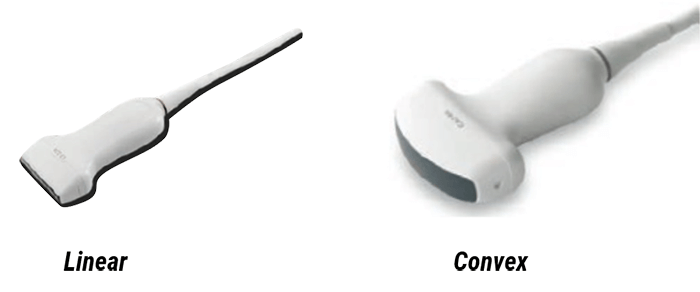
Shapes and Dimensions
- The Linear transducer where the crystals are arranged in linear form, the shape of the beam is rectangular with a good resolution. This type of transducers is used for different applications such as vascular, blood vessels, breast, thyroid, and tendon examination. It is also used in the measurement of body fat and musculus thickness for daily health care checks
- The Convex transducer is characterized by the curvilinear arrangement of the crystals. It is used for abdominal examinations, transvaginal and transrectal examinations, and Gynecology
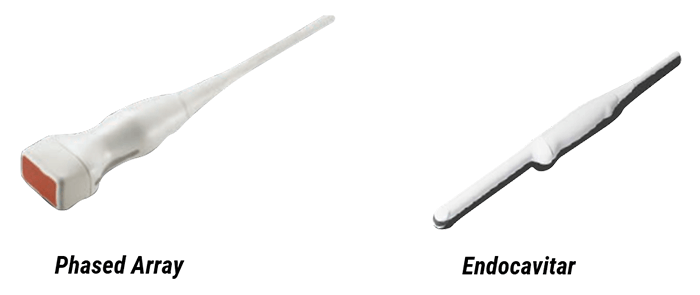
- The Phased array transducer, which is the most commonly used, has a small footprint and low frequency. It is used for Brain, abdominal, and cardiac examinations
- The Endocavitary transducer, that is mainly used for gynecological and prostate examinations
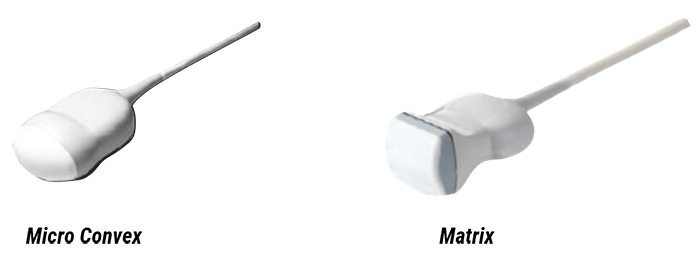
- The Micro convex, that is used in Obstetrical, gynecological, and urological examinations
- The Matrix, used for the Soft part, and the musculoskeletal part
Propagation Speed
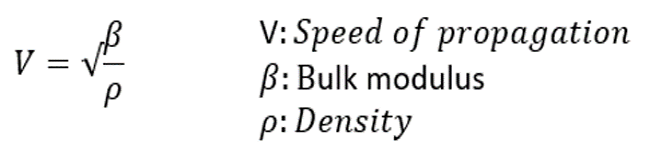
Theoretically, the speed of propagation is the speed at which sound travels through a particular organ and is dependent on the elastic property and density of the organ. The harder the tissue, the faster the speed of propagation. The average speed of sound in soft tissues such as the chest wall and the heart is 1,540 meters per second.

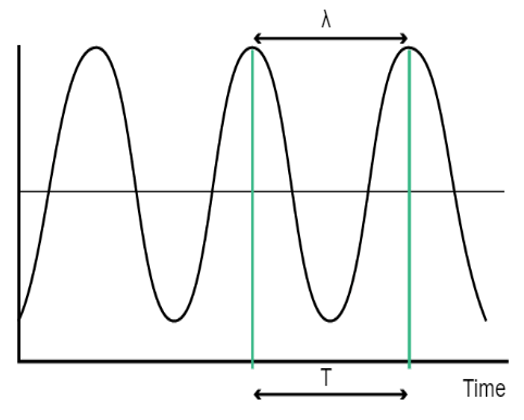
Wavelength
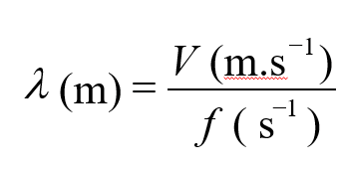
The wavelength is the distance traveled by the sound during a single cycle, or between two identical points in the cycle of the wave. It is the distance between two points of compression peak that follow one another. Please note that the frequency and the wavelength are inversely proportional, when the frequency increases, the wavelength decreases, and vice versa.
The wavelength (l) and the frequency (f) are connected by the below formula:
Find below the different wavelength values of the ultrasound wave while it passes through some organs and tissues.
Acoustic Impedance
The acoustic impedance is a physical property of biological tissues. It describes the resistance that an ultrasound wave encounters as it passes through a tissue. It is important to know that the discontinuities in the acoustic impedance are responsible for the echoes on which the ultrasound imaging is based. The higher the difference in impedance, the greater the amount of reflection. The acoustic impedance depends on the density of the tissue(ρ in kg/m3) and the speed of the sound wave-wave (V in m/s); if the density of tissue increases, impedance increases. Similarly, if the speed of sound increases, then impedance also increases. Z = ρV
Let’s discuss the variation of acoustic impedance in different body tissues.
| Body Tissue | Impedance (MRayl) |
| Water | 1.48 |
| Air | 4.40 10-4 |
| Blood | 1.66 |
| Fat | 1.35 |
| Liver | 1.65 |
| Muscle | 1.70 |
| Skin | 1.75 |
| Cortical Bone | 7.00 |
The bones have a high degree of reflection because their acoustic impedance is extremely high (7.8) compared to other tissues of the body. The air has a high degree of reflection because its acoustic impedance is extremely low (0.0004) compared to other tissues of the body. For this reason, it is important to apply a good quantity of conductive gel (a medium of acoustic coupling) on the transducer surface to eliminate any air pockets between the transducer and the skin surface.
Otherwise, most of the ultrasound waves will be reflected, limiting the penetration into the tissue. Highly dense tissues, such as bone or kidney stones, easily reflect echoes, and therefore, appear in white on an ultrasound image. Also, as in the intestine, the air reflects the echoes easily, so that the edge of the intestine appears in white on an ultrasound image. Thus, substances whose density differs significantly may appear in white on an ultrasound image. The acoustic properties of soft tissues are very similar to those of water. However, the acoustic property of the air is distinctly different; thus, the presence of air between the probe and the tissue of interest can deform and obscure the image. For this reason, a density of water, called coupling means, is used for the transmission of the ultrasound image. This coupling means is usually a sonographic jelly or lubricant that should be placed between the probe and the skin surface. At an air-tissue interface, 99% of the beam is reflected, and therefore, the application of this gel is highly important.
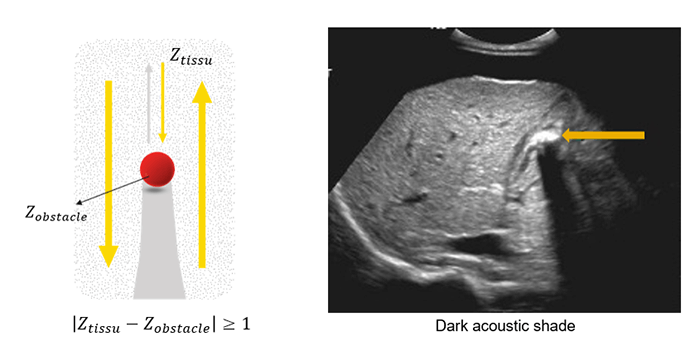
The greater the difference in acoustic impedance between two adjacent tissues, the more ultrasound energy will be reflected at the boundary. The acoustic shadow occurs when the sound wave meets a very dense structure. Almost all the sound is reflected, resulting in an acoustic shadow. Shading can occur due to intense reflectors such as calcification, air, or bone.
Now that we have a basic understanding of the piezoelectric effect and the ultrasound propagation, we will discuss the ultrasound attenuation phenomenon that occurs while the ultrasound wave travels through tissues or organs.
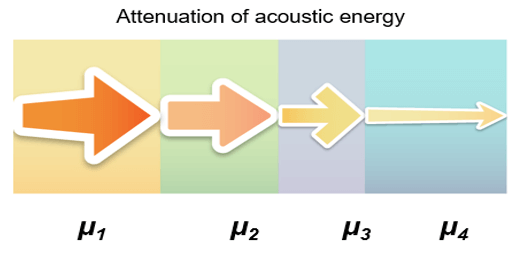
Global Attenuation
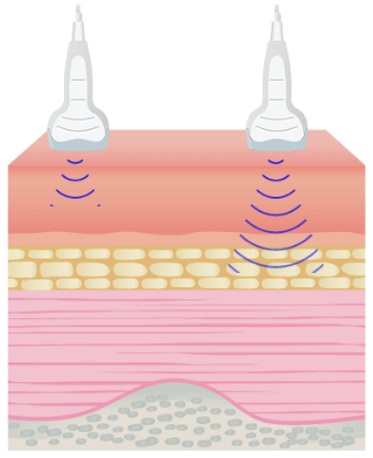
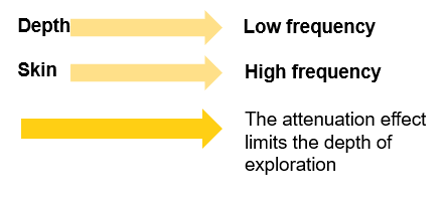
The amplitude and intensity of ultrasound waves decrease as they travel through tissues. Theoretically, the attenuation coefficient (μ) in soft tissues, is almost proportional to the ultrasound frequency and depth, with a range between 0.5 and 1 dB / (MHz.cm).
The attenuation is one of the parameters that limit the maximum frequency. It is important to note that lowering the frequency improves the depth of exploration because the ultrasound attenuation primarily increases with frequency. The maximum depth of exploration with a center frequency of 20 MHz is approximately 6-10 mm.
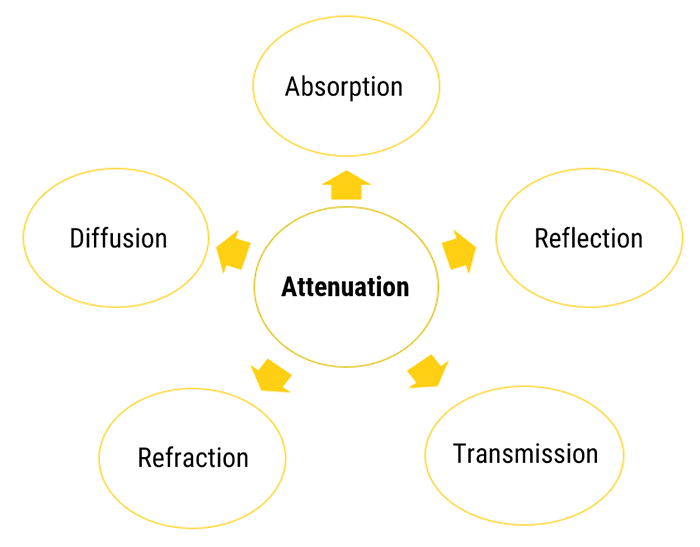
The sound energy is attenuated or weakened as it passes through the tissues. In fact, as the ultrasound wave travels through a medium, parts of it are reflected, scattered, absorbed or refracted.
Absorption
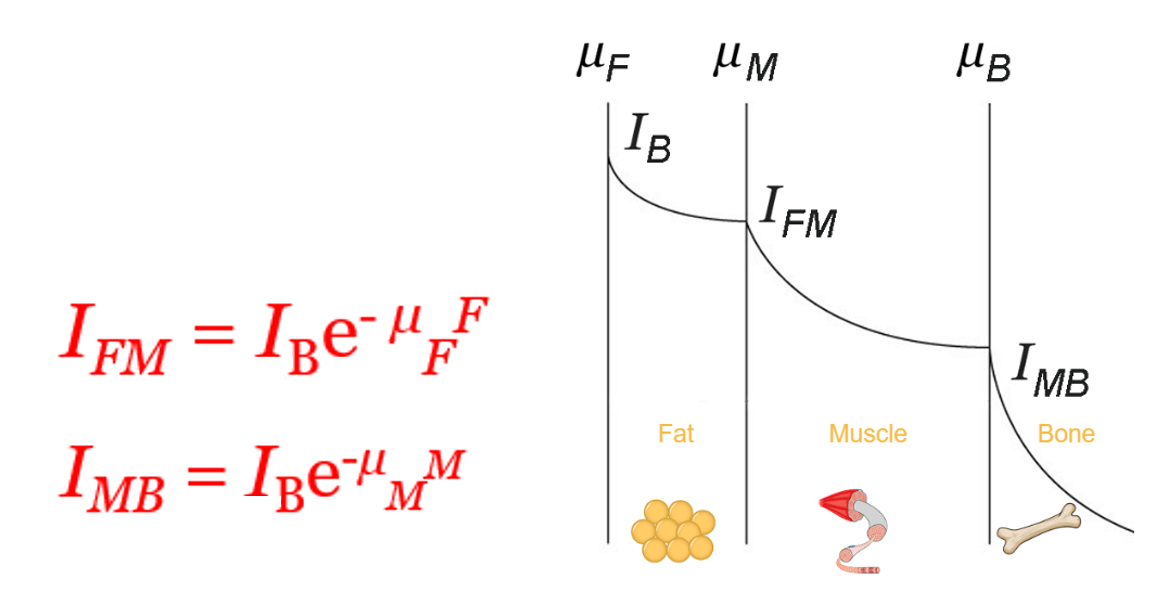
As discussed previously, the absorption is the reduction in the intensity of the sound waves as it passes through a tissue. Most of the energy loss is in the form of heat. The absorption of the sound energy in tissues largely contributes to its overall attenuation, where the degree of attenuation depends on the biological tissue, and the frequency of the wave. The degree of soft tissue attenuation follows an almost linear relationship with the frequency.
- The higher the frequency, the greater the attenuation
- As the attenuation increases, the depth of exploration decreases

The ultrasonic energy is attenuated exponentially while the wave passes through the tissues. We can conclude that the ultrasound wave is strongly attenuated by the bones than other organs.
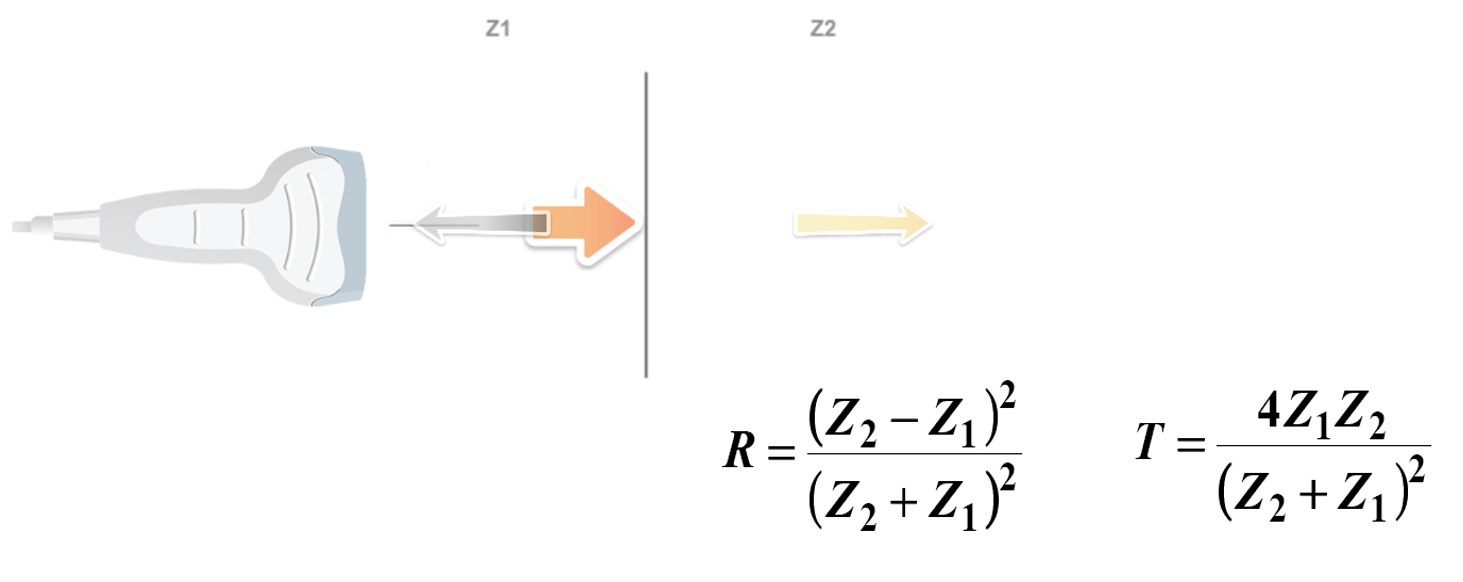
Reflection / Transmission
The Reflection of a sound wave occurs when the wave passes between two tissues of different acoustic speeds and a fraction of the wave ‘bounces’ back. Sound waves that are reflected directly to the transducer will lead to the vibration of the crystals, thus causing an electrical signal and creating the desired image. The equations of transmission and reflection of the ultrasonic intensity are independent of the frequency. Therefore, changing the transducer frequency does not change the transmitted or reflected intensity fraction at an interface. The three beams have the same direction.
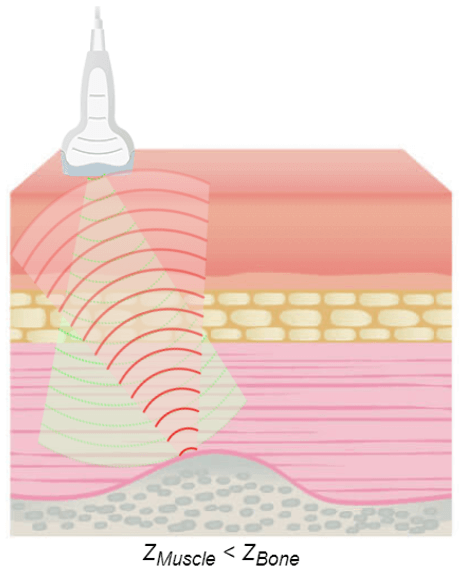
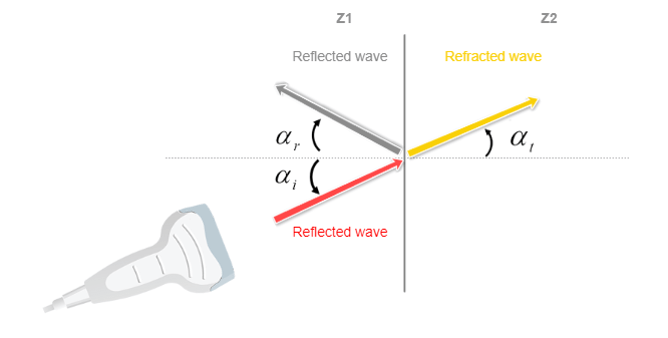
Reflection / Refraction
Another phenomenon is the Refraction of a sound wave, which occurs when the wave travels between tissues with different propagation speeds. The refraction is defined by the change in the direction of the sound wave and is determined by Snell’s law. We can see how the direction of the wave has changed or deviated, as it passes through the interface.
Transmitted sound waves will continue its propagation, and will certainly be again reflected, refracted, or transmitted. The “rules” of reflection are identical to those that apply to light. An incident wave that collides with an inclined smooth surface will not be reflected to the source.
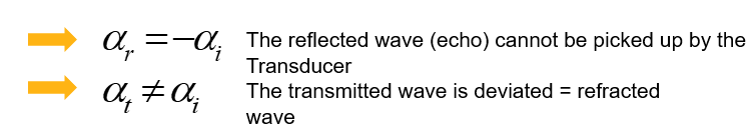
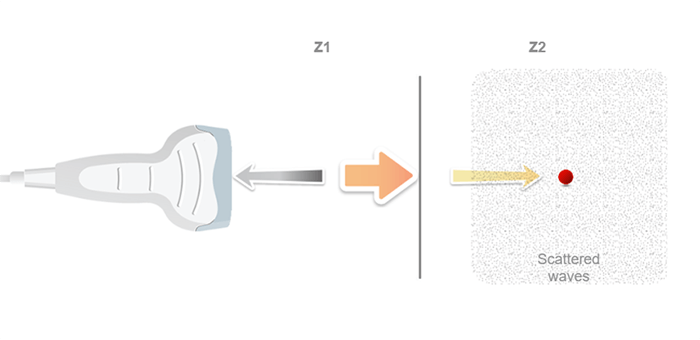
Diffusion
In Conclusion, we can say that not all echoes will return back to the probe. Some of them are scattered in all directions, creating images with artifacts. This is specifically true for very small objects or rough surfaces.
Essential
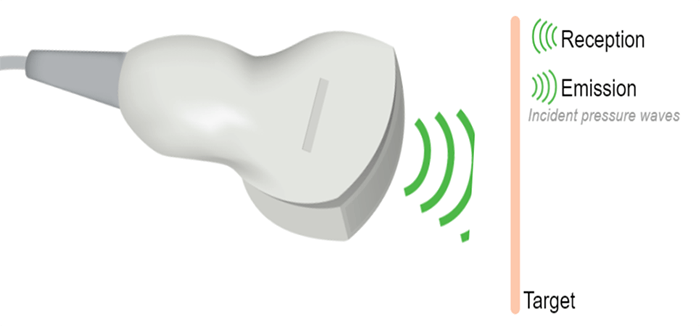
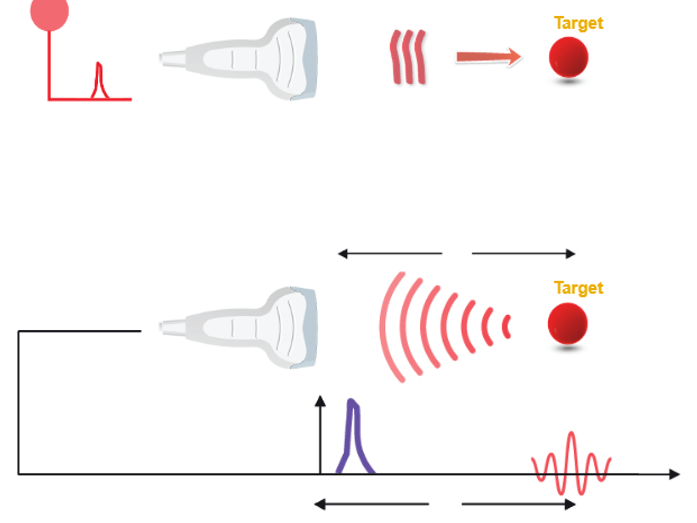
An ultrasound probe emits a pulse in response to electrical excitation. This ultrasonic pulse, transmitted to biological tissues, spreads by degrees.
The echoes are generated by reflection or scattering and propagate backward towards the probe, which operates in receiver mode immediately after the pulse is transmitted. Whenever an echo reaches the surface of the probe, an electrical signal is produced, having an amplitude proportional to that of the echo.
If we consider that an ultrasound wave propagates in the soft tissues at a constant mean speed c, the time t (echo flight time) that elapses between the emission and the reception of an echo, corresponds to the duration of a round trip to the target which is expressed simply by the fundamental relationship of ultrasound: ct = 2z, where c is the ultrasound speed, t is the time of propagation, and z is the penetration distance.
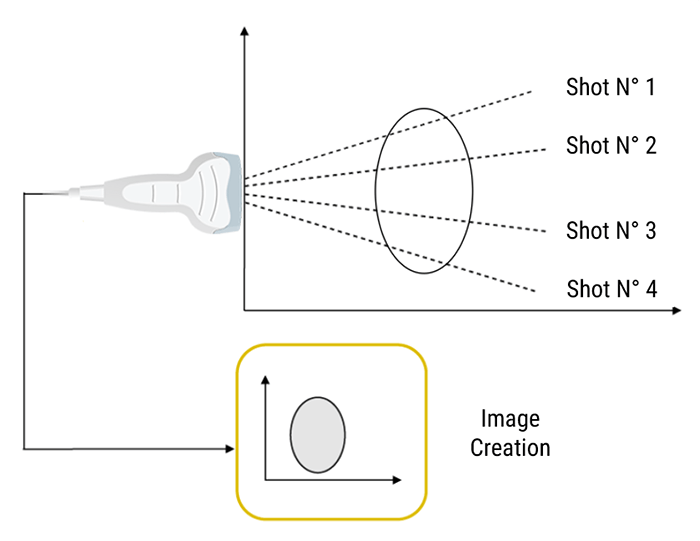
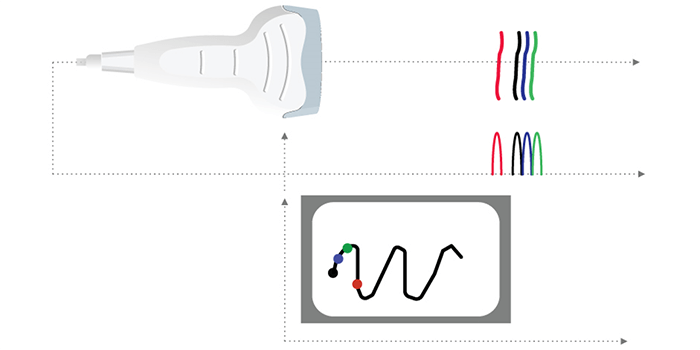
Scanning Technique
However, It is sufficient to perform a large number of different ultrasound shots by shifting the firing axis each time. The position of a point on the screen depends on the flight time of the echo and the position of the corresponding ultrasonic firing axis.
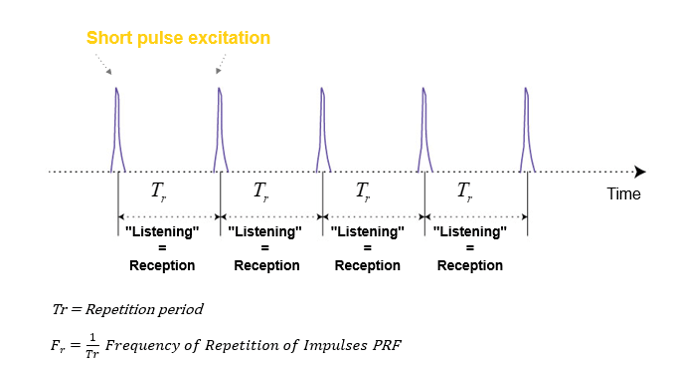
Sequence of Ultrasound Shots
What is Pulse Repetition Frequency? And what does it depend on?
Pulse Repetition Frequency (PRF) is the number of ultrasound pulses emitted by the transducer per second. It depends on the speed of sound and the depth of exploration; Thus it can be altered by changing the depth of imaging. The further the ultrasound travels into the tissue, the higher the PRF becomes.
Beam Orientation
Mechanical Scanning
It is important to know that a 2D ultrasound sweeps its field of view using either a mechanical motor or having an array of elements using electronically focused beams that are available in most modern systems. Let’s start with the Mechanical scanning probe, that rotates a single transducer, or array of transducers mechanically. It pulls one pulse in each direction and then waits for the pulse to return before rotating the transducer one step.
Electronic Focusing and Beam-steering
Moving on to the electronic scanning technique, a subset of piezoelectric elements work together to produce the focused beam. Each of the transducers is excited with time offsets. The combination of several focal lengths at the emission improves the quality of the image.
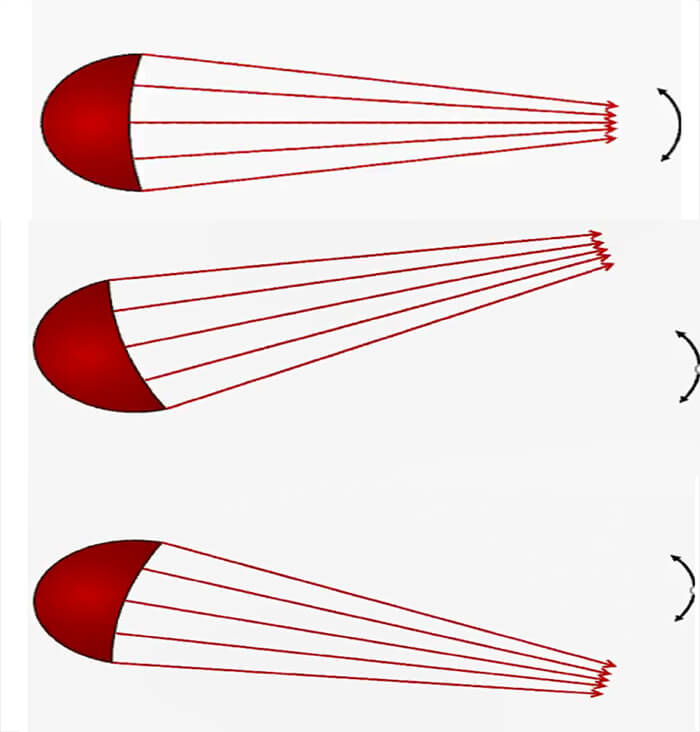
Steering the Beam Electronically through the Scan Plane
The beam is electronically steered to scan a 2D plane.
General
The resolution is defined as the ability to distinguish and identify two objects. It includes spatial and temporal resolutions. Spatial resolution is the ability to distinguish two separate objects that are close to each other. Whereas the temporal resolution refers to the ability to visualize moving objects. The main determinant of temporal resolution is the frame rate.
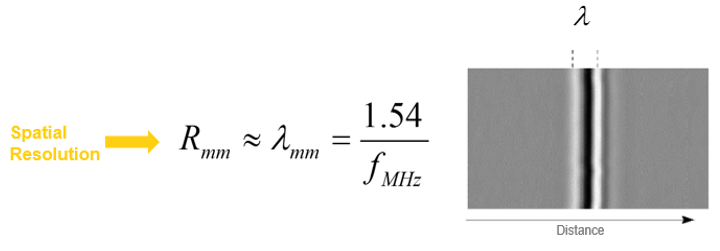
Spatial Resolution
Besides, the spatial resolution determines the degree of image clarity. It is divided into axial resolution, which is the capacity along the axis of the ultrasonic beam, and lateral resolution, which is perpendicular to the axis of the beam. The limit of the theoretical (spatial) resolution system is given by the wavelength of the ultrasound wave. The velocity of propagation in the soft tissues is about 1540 m/s.
Axial Resolution
The Axial Resolution is the minimum distance that can be differentiated between two reflectors located parallel to the direction of the ultrasound beam.
Mathematically, it is equal to half the spatial pulse length.
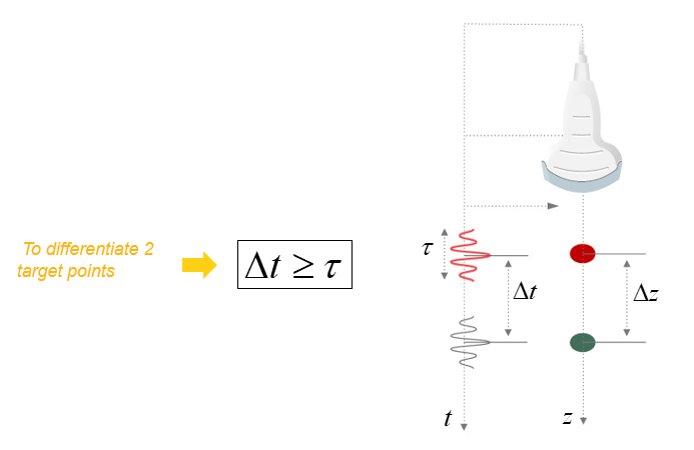
However, the Axial resolution is limited by the duration of the ultrasonic pulse. It is high when the spatial pulse length is short.
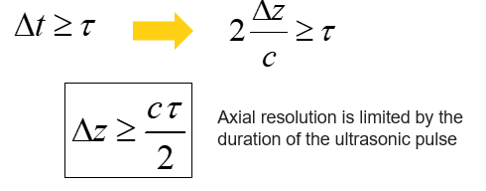
The axial resolution or the resolution in the direction of the axis of the ultrasonic beam depends on the duration of the ultrasonic pulse.

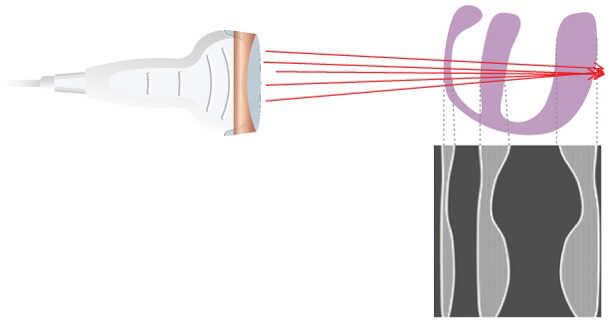
Lateral Resolution
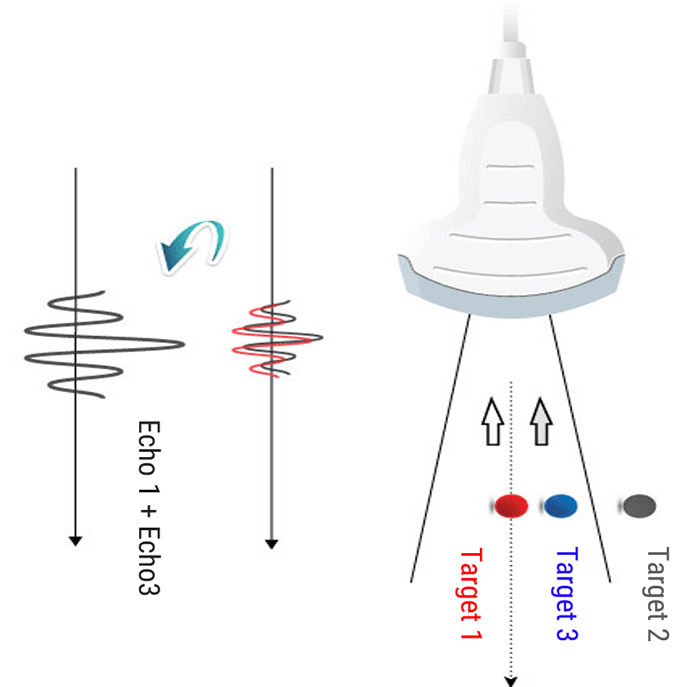
As we mentioned previously, lateral resolution means the resolution of objects located side by side (perpendicular to the axis of the ultrasonic beam). The lateral resolution is directly related to the width of the ultrasound beam, which is inversely related to the ultrasonic frequency. It is the ability to distinguish between two separate objects that are close to each other and are in a direction perpendicular to the beam axis.
A high-frequency transducer emits a wave with short wavelength and reduced width of the ultrasound beam. The lateral resolution is weak when the 2 structures, side by side, are located in the same width of the beam. Since the return echoes overlap in this case, the two structures will appear as one in the corresponding image.
It is therefore important to choose high-frequency transducers, in order to keep the beam width as narrow as possible and achieve the best possible lateral resolution. However, attenuation also increases with frequency, so a compromise must be found between resolution and mitigation.
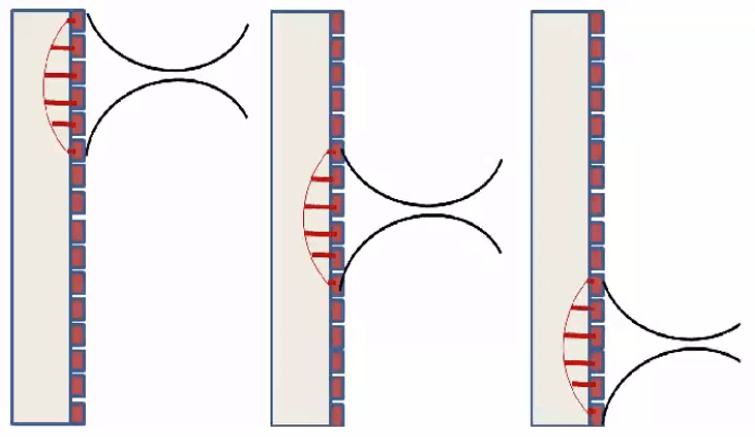
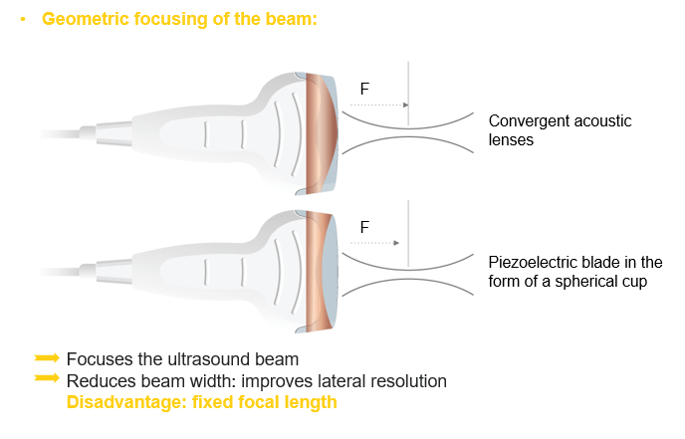
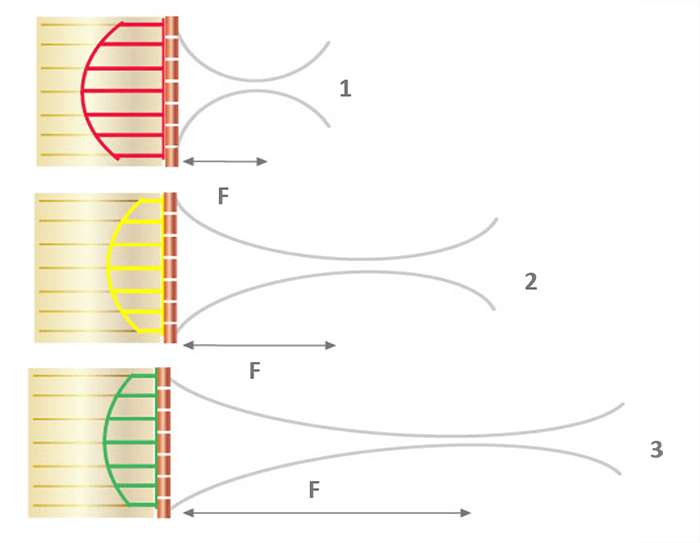
The beam width can be further reduced by adjusting the focal area. It is, therefore, useful to position the target structure in the focal zone to obtain the best possible lateral resolution. The beam diverges increasing its width while propagating in depth. It is possible to focus the ultrasound beam to obtain a narrow beam at the focal length, and thus improve the lateral resolution. Focusing can be accomplished either mechanically, or electronically via a multi-element array.
Electronic Beam Focusing
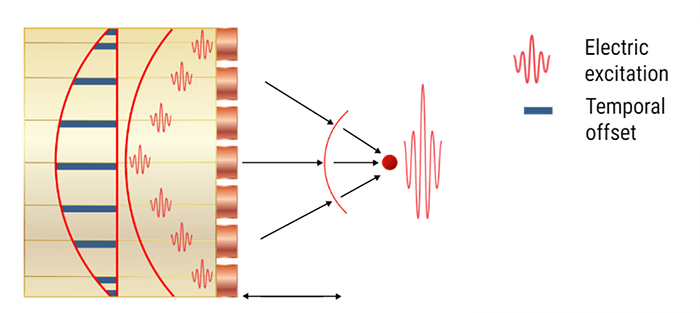
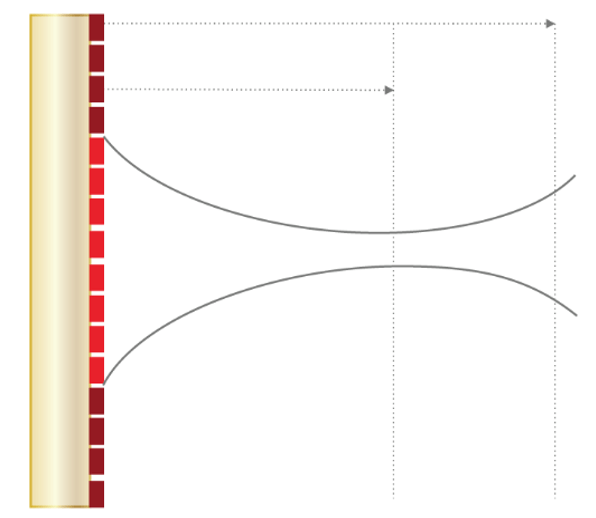
The focusing of some transducers can be adjusted to a specific depth for each transmitted pulse. The transducer is made up of an array of several piezoelectric elements, rather than a single element compared to the fixed focus transducer. As shown in this animation, the elements are arranged in either a straight, or curved line in the linear array.
Focusing is achieved by not applying the electrical pulses to all of the transducer elements simultaneously. The pulse to each element is passed through an electronic delay The outermost elements will be pulsed first, which produces ultrasound that begins to move away from the transducer. The other elements are then pulsed in sequence, working toward the center of the array.
The centermost element will receive the last pulse. The pulses from the individual elements combine in a constructive manner, to create a curved composite pulse, which will converge on a focal point at some specific distance or depth from the transducer.
The focal depth is determined by the time delay between the electrical pulses. Focal Pulses can be changed electronically to give a good image detail at various depths within the body, rather than just one depth compared to the fixed focus transducer. One approach is to create an image by using a sequence of pulses, each one focused on a different depth or zone within the body.
Another approach is a group of piezoelectric elements that work together to produce the focused beam. Each of the transducers is excited with time offsets. The combination of several focal lengths on transmission improves the quality of the image. In return, the frame rate is decreased by a factor equal to the number of selected focal lengths. And last, the image is reconstructed by zone.
Slice Thickness
The slice thickness is the dimension of the ultrasound beam that is perpendicular to the image plane. It determines whether the reflections on the image were created directly from structures located inside the section plane, or outside the imaging plane. When the slice thickness is thick, artifacts are produced.
Temporal Resolution
The temporal resolution represents the capability of the ultrasound system, to differentiate between instantaneous events of different moving structures. The number of images produced per second determines the temporal resolution. In cardiac ultrasound, sonographers mainly study the heart wall and the valves’ movements, therefore the temporal resolution, and thus the frame rates of the system are very important. Please note that mechanical transducers are generally not used in cardiac ultrasound imaging as their frame rate is very slow.
As a conclusion, if the desired depth is reduced, then the time between sending and receiving the pulse is reduced; and the next pulse (for the next beam) can be emitted earlier; thus the scanning speed and cadence will be increased.
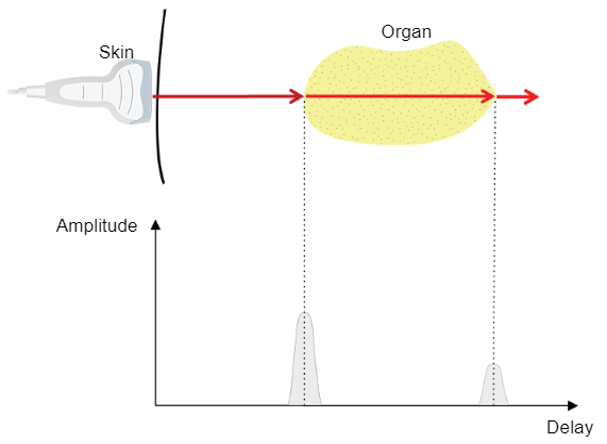
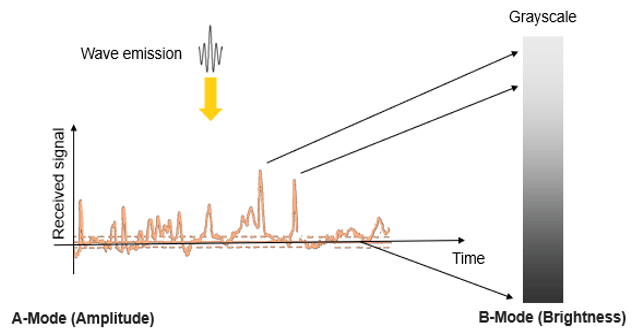
A-Mode
Different ultrasound modes are used in medical imaging today. The A-Mode, or Amplitude Modulation, was the first discovered mode. It is the display of amplitude spikes of different heights, where it consists of an X and Y axes. The X-axis represents the depth, while the Y-axis represents the Amplitude. This image shows an example of the A-Mode display.
The A-mode is mainly used for ophthalmology studies, to detect findings in the optic nerve. Delays are used to determine the depth of an organ, or otherwise to estimate the dimensions of an organ.
B-Mode
The B-Mode, or Brightness Modulation, is the most common form of ultrasound imaging. It is the display of a 2D map of B-Mode data. The B-Mode is based on the brightness which depends on the intensity of the returning echo. In the B-Mode, there is a Z-axis, which represents the echo intensity or amplitude in function of the depth. The B-Mode will display an image of large and small dots, representing strong and weak echoes respectively.
The amplitude of the echo modulates the gray level of a video monitor. This mode allows the representation of ultrasound data collected in a 2-dimensional image.
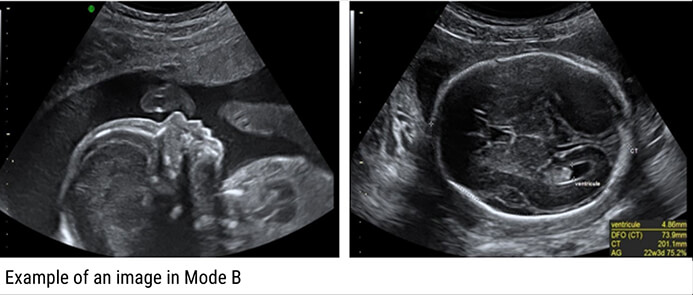
Therefore, the solid areas will appear in white, whereas the fluid ones in black.
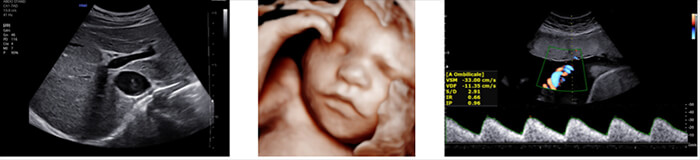
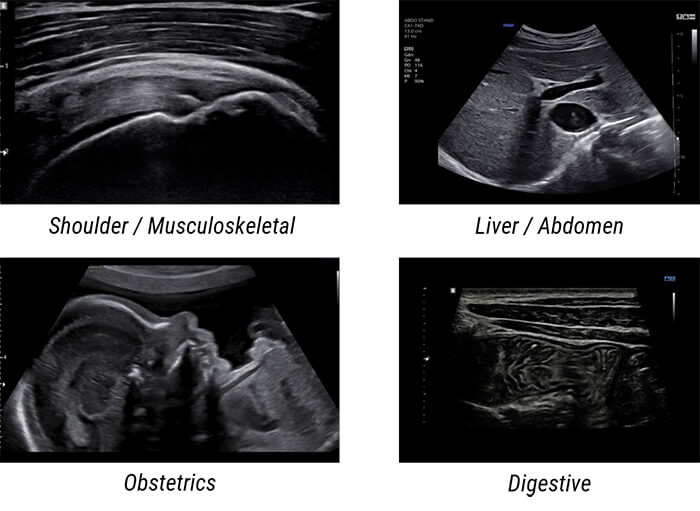
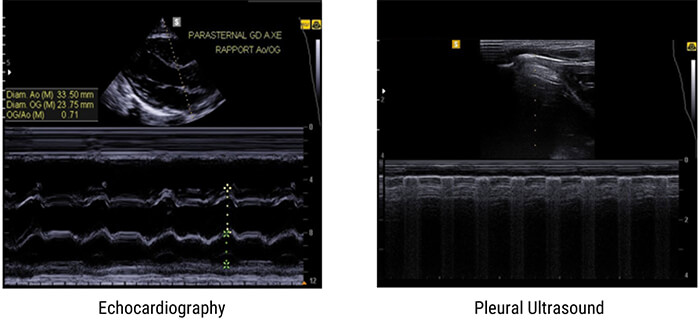
Examples of Images: The gray levels reflect variations in the texture of the internal organs as shown in these 4 different clinical images.
M-Mode
The M-Mode, or Motion Mode, is used to analyze moving body parts, and commonly used in cardiac and fetal cardiac imaging. It is based on the principle of recording the amplitude and rate of motion in real-time, by continually measuring the distance of the object from the single transducer at a given moment. The single sound beam is transmitted, and the reflected echoes are displayed as dots of varying intensities, thus creating lines across the screen.
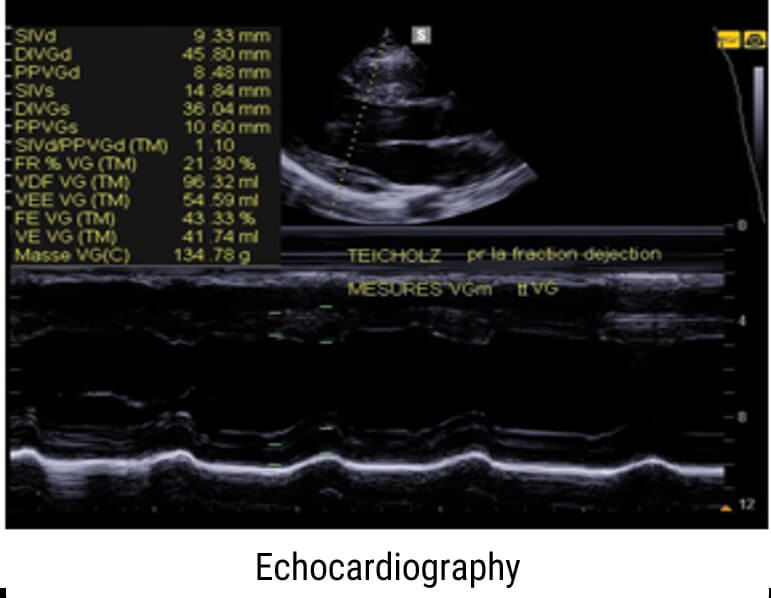
The M-Mode (Motion Mode) is and commonly used in cardiography, where the direction of the beam is fixed and the returned echoes are recorded as a function of time.
Previously, we mentioned that the M-Mode is a unidirectional examination mode, that allows the analysis of tissue movement. This mode of representation is obtained by scrolling successive ultrasound signals corresponding to the same direction of the beam on a video monitor. The amplitude of the signal is coded in gray level, and useful in echocardiography for the analysis of heart valve movements.
Examples of Images
Here are some examples of M-Mode images, where the motion of the body part being scanned is displayed along the horizontal axis.
3D Ultrasound
One of the most commonly used imaging modes in gynecology is the 3D mode, which is a series of data that contains a large number of 2D planes (B-mode images).
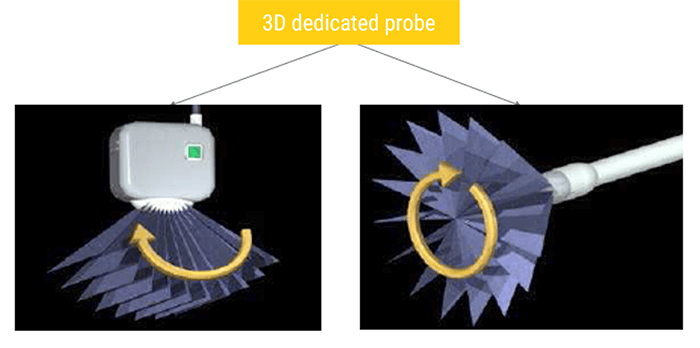
In general, 3D ultrasound imaging can be conducted with three main stages: acquisition, reconstruction, and visualization. The acquisition refers to collecting the B-scans with relative position using conventional 2D probes or directly obtaining 3D images using dedicated 3D probes. The reconstruction aims to insert the collected 2D images into a predefined regular volume grid. Whereas the visualization is to render the built voxel array in a certain manner like any-plane slicing, surface rendering, or volume rendering.
3D images are acquired using 2D probes or dedicated 3D probes. In a mechanical 3D probe, a regular linear array transducer is motored to tilt, translate, or rotate to emit and receive the ultrasound waves. Two types of mechanical scanning are illustrated, which are tilting scanning, and rotational scanning.
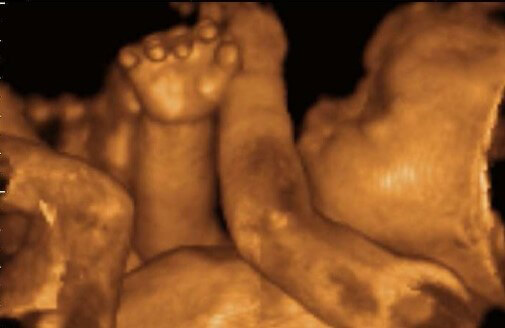
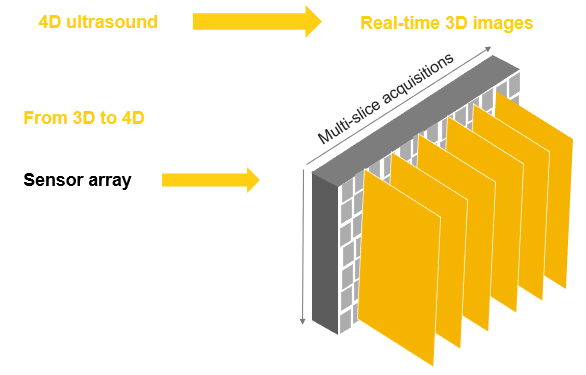
4D Ultrasound
A 3D ultrasound allows the visualization of static 3D images. Whereas a 4D ultrasound allows the addition of a live streaming video, showing the motion of the moving structures, such as the fetal heart, or the blood flow in various vessels. In other words, a 4D ultrasound is actually a 3D ultrasound in live motion. The 4D image is achieved by repeating 3D images in short intervals.
What is an Artifact? And what is the cause of getting an artifact in an ultrasound image?
Artifacts in Ultrasound Diagnostics are a reflection or echo that appears on the display and represents the actual structure of the anatomy incorrectly. An artifact may be false, multiple or misleading information introduced by the imaging system or by the interaction of ultrasound with the adjacent tissue.
Some artifacts have their origin in a wrong setting of the device. For example, an excessive level of amplification may reveal scattered echoes in a fluid-structure (bladder, artery) corresponding to an exaggerated amplification of the noise. Other artifacts are related to the nature of the interactions between ultrasound and tissue. We can mention these 4 main artifacts: The acoustic shade, the posterior strengthening, the reverberation, and the mirror imaging.
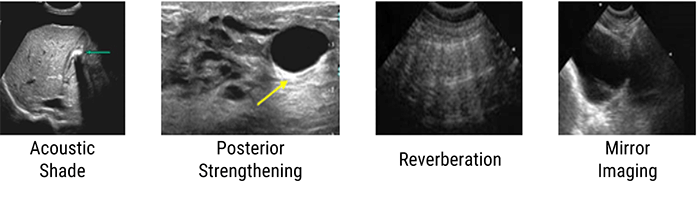
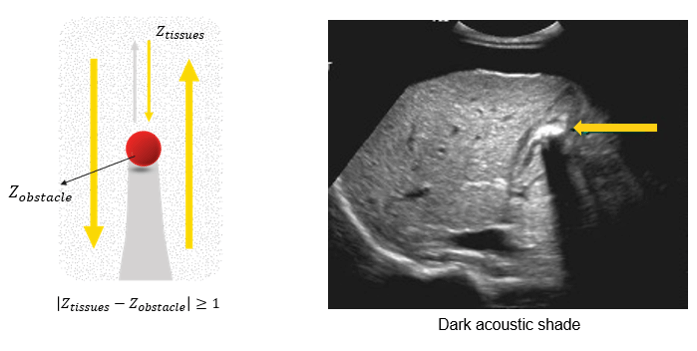
Acoustic Shade
The acoustic shadow phenomenon occurs whenever the ultrasonic beam is intercepted by a highly reflective structure. This is the case of bones, digestive gases, kidney stones, or gallstones. In this image, the reflecting wall is represented by a very intense echo behind, which is projected in a cone of acoustic shadow where no image is visible. This artifact aids in the identification of calculi and also prevents the examination of deeper structures.
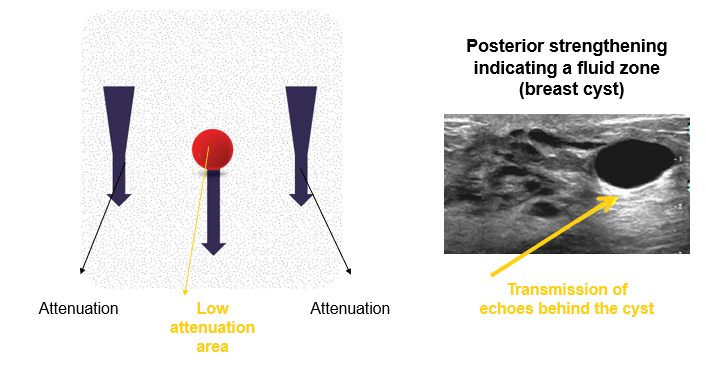
Posterior Strengthening
The second artifact is the posterior reinforcement artifact, which often occurs when the echo passes through a fluid zone (cyst).
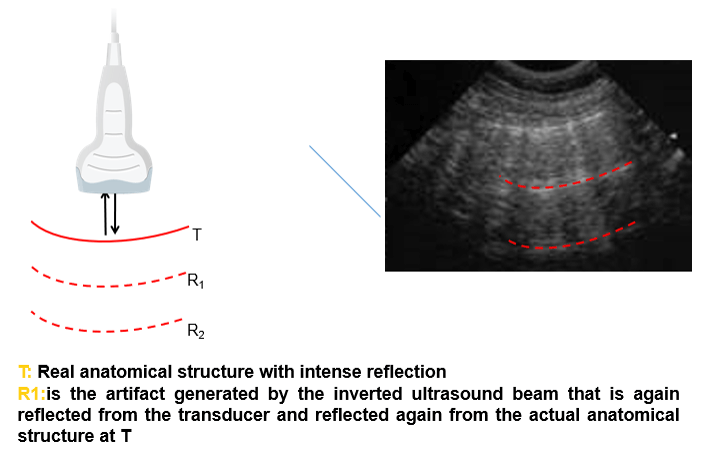
Reverberation
The third artifact is the reverberation artifact, which is related to the “trapping” of ultrasound waves between two reflective surfaces. These waves bounce between the surfaces, where at each bounce, a small echo is released to the probe and forms an image. This reverberation causes a repetitive artifact on the ultrasound image. The appearance of the reverberation artifact depends on:
- The size of the two reflective surfaces
- The distance between the two reflective surfaces (long vs short path reverberation artifacts)
- And how much ultrasound energy is dissipated or attenuated, between each re-reflection
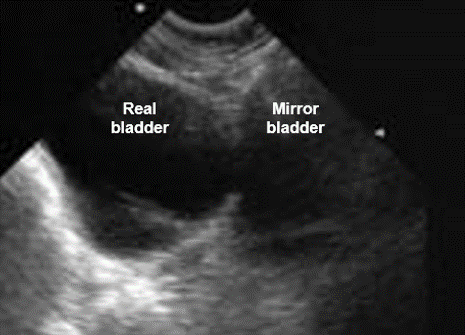
Mirror Image
And finally, the mirror image is formed near a very reflective interface; it is observed mainly at the diaphragm. The ultrasound is reflected on the diaphragm towards the liver tissue and then they follow the opposite way. The ultrasound machine ignores this reflection and considers it as a rectilinear movement of the ultrasound.
On / Off
First, to be able to use an ultrasound machine, it is necessary to turn it on. Besides, it is also very important to turn it off immediately after finalizing all the appointments.
Output Power Control
Output power is equivalent to how loud the probe shouts when sending out its pulse. Controls the strength of the voltage spike applied to the crystal at pulse emission. Increasing power output increases the intensity of the beam and therefore the signal to noise ratio (SNR).
A stronger pulse will generate stronger echoes and that is generally a good thing. The louder sound bounces around a bit more inside the body and that can create more artifacts such as reverberations and distortions. If you’re scanning something superficial, clearer images can be obtained by turning the output power down and the gain up. It is better to operate on minimum power and maximum gain.
Patient Data Entry
With the arrival of a new patient, you always start an exam by entering the patient’s data into the system. Generally, all systems use a unique ID to identify each patient. You can enter an ID, or some systems create one automatically. Images, fetal growth graphs, and reports are stored based on the patient ID.
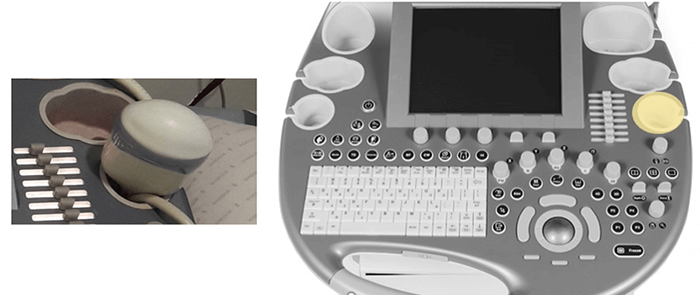
Select / Change Probes
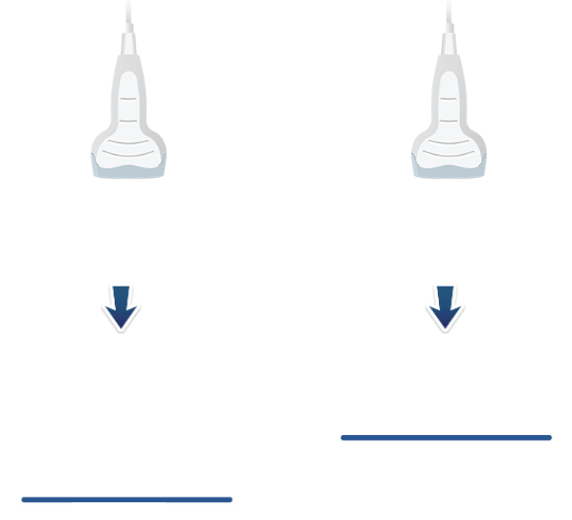
When the system is turned on, it is very important to select the right probe for the right type of exam. The transducer head has an imprint area, where the sound waves leave and return to the transducer. It is this area of the transducer footprint that must remain in contact with the body to transmit and receive ultrasonic waves. Each transducer has a probe to help identify its orientation. Transducers are manufactured in a range of shapes, sizes, and frequencies and are suitable for specific clinical applications.
Depth Control
Varying the depth of the F.O.V. varies the number of pixels per cm and the spatial resolution of the system. It is important not to only use excessively large F.O.V’s that reduces the spatial resolution, but also not to ‘clip’ the F.O.V. too tightly around the region of interest. Low ultrasound frequencies are used to increase the exploration depth.
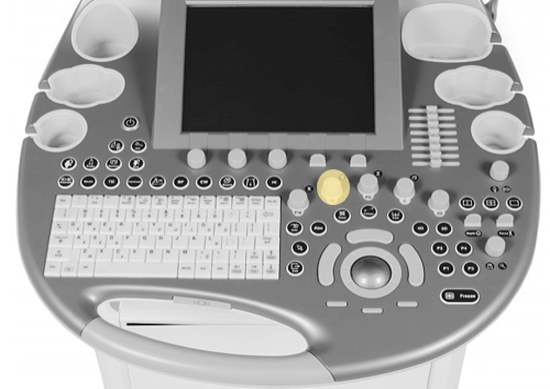
Gain
This function is very similar to brightness control. The echo signal returning to the body is converted into an electronic signal by the transducer. This electronic signal has to be amplified to produce images on the monitor. This signal amplification is called Gain and will regulate the strength of the echo’s being received.
In practice, if the gain was set too low, there will be underwriting of the image, and real echo will be lost from the display. However, if it was set too high, there will be overwriting of the display with a reduction in contrast resolution as all echoes get progressively brighter.
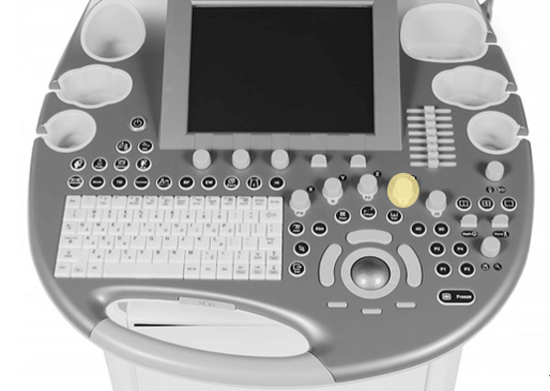
TGC
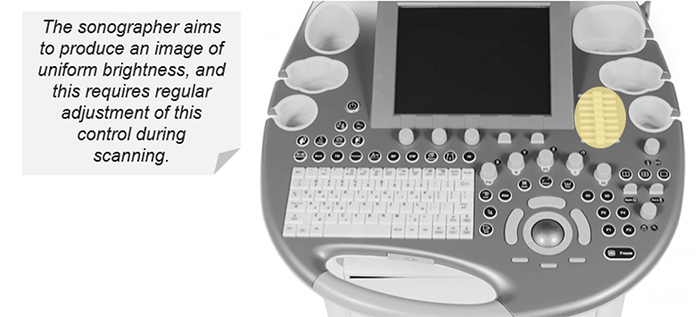
Since the ultrasonic waves are attenuated or absorbed, as they pass through the tissues, the reflected waves of the farthest areas are weaker than the waves reflected from the areas near the transducer. Without TGC, the image would have a gradual brightness ranging from light to dark (from the near field to the far-field).
TGC is an adjustment of the sensitivity at each depth, it allows the compensation of signal loss from deeper tissues. TGC is a series of multiple sliders so you can set the time-gain differently for each depth. This results in a uniform brightness in the entire field of view. For example, the TGC shall be set so that organs such as the liver will have uniform brightness at all depths.
To summarize, the T.G.C. compensates for the effects of attenuation by gradually increasing the amplitude of amplification applied to the signals as a function of the depth (time). The sonograph aims to produce a uniform brightness image from top to bottom, which requires regular adjustment during scanning.
Focal Zones
Throughout the scan, the sonographer should constantly check the position of focal areas and ensure they are at the depth of interest. Several focal areas can be used to maximize lateral resolution with respect to depth if motion is not encountered. Please note that it is important to minimize the focal areas used when evaluating moving structures such as the fetal heart.
Most systems now allow a variable depth of focus by varying the firing delays of the crystal elements across the array. Keep in mind, always keep the focal zone(s) to the depth of interest.
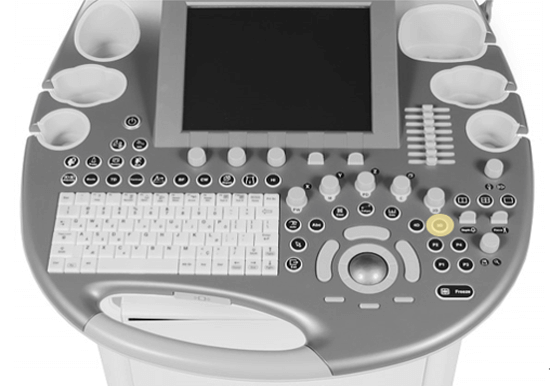
Freeze
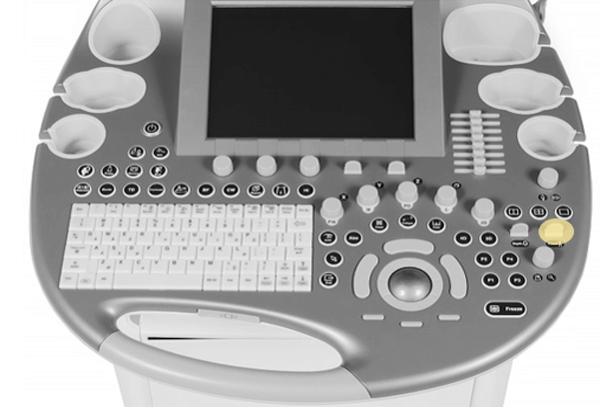
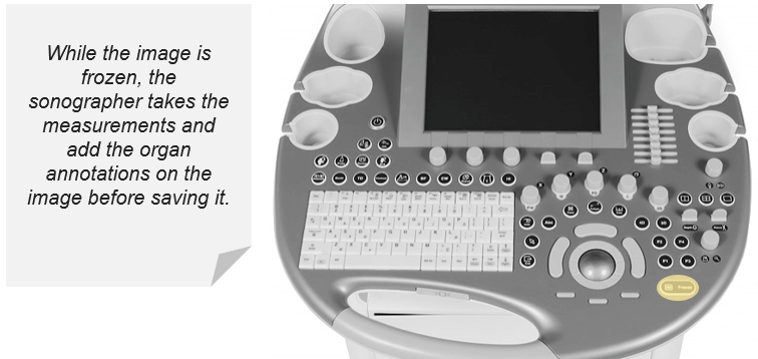
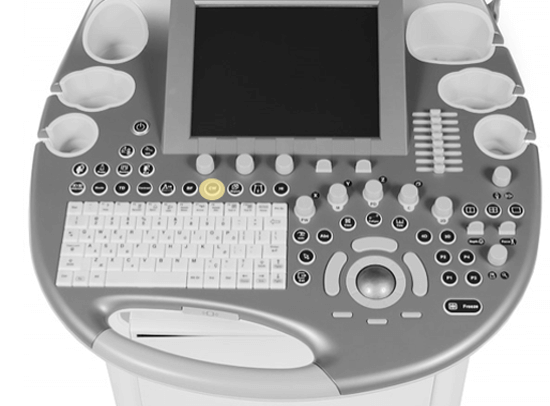
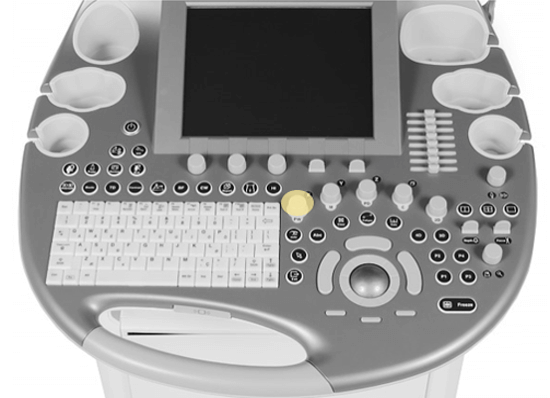
What is freeze? And how can it help in ultrasound?
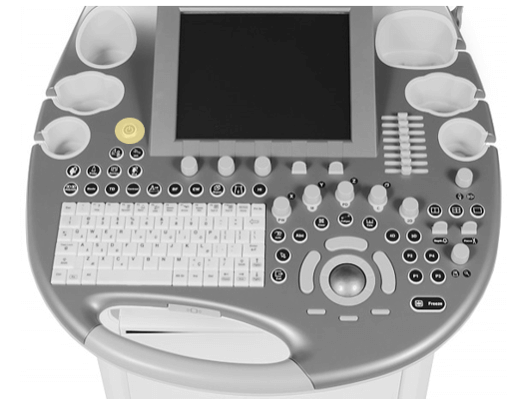
The ‘Freeze’ button is the large blue button in the direct center of the control panel, labeled with a snowflake. Freeze function stops imaging and freezes the image. While the image is frozen, the sonographer takes the measurements and adds the organ annotations on the image before saving it.
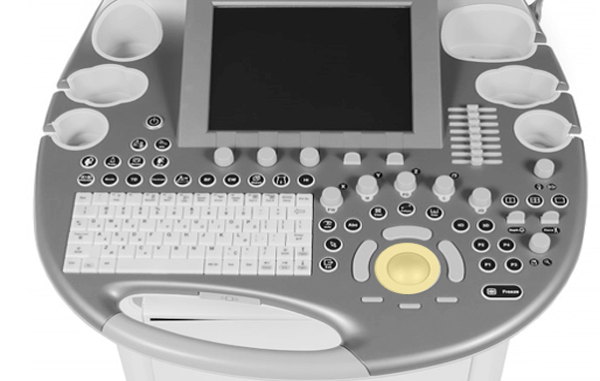
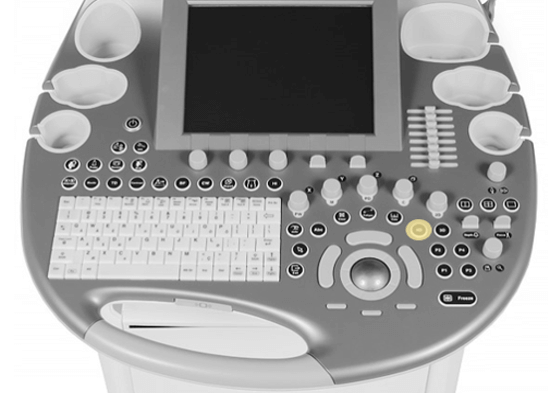
Trackball
The trackball is used to move the cursor on the image or to navigate through the menus. It is used to move objects on the monitor (same as using the mouse on the computer), measure, annotate and move the Doppler boxes to the desired location. It has kidney buttons either side which is used to select functions (the same as clicking buttons on a mouse for the PC).
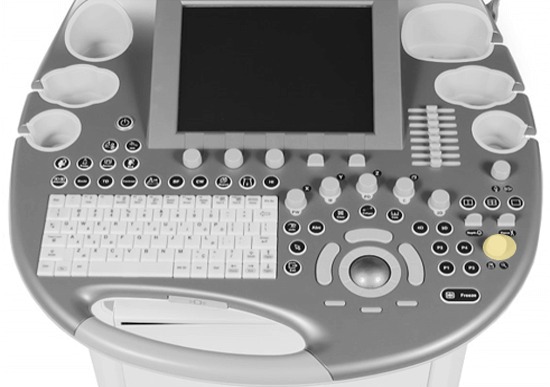
Zoom
Zoom allows magnification of areas of the ultrasound image. Looking at zoomed areas of interest has the advantage of a more detailed view with the drawback of less anatomy visible to guide your movements. Please note that Increasing the zoom magnification by pressing Zoom, may increase the frame rate.
3D
As explained previously, 3D ultrasound is a series of data that contains a large number of 2D planes (B-mode images). Once the volume is acquired using a dedicated 3D probe, you can navigate through the different 2D planes that make up the total volume. Once you have all the data, you can also see the different planes by rotating the volume.
4D
4-dimensional ultrasound imaging is based on acquiring and displaying a series of 3D data with their reconstructions and multi-planar renderings in real-time while scanning the patient. 4D scans show moving 3D images of your baby for example.
M-Mode
You can start M-mode by pressing the M-mode soft key, and then press the middle trackball button to update the M-mode display.
Color Doppler
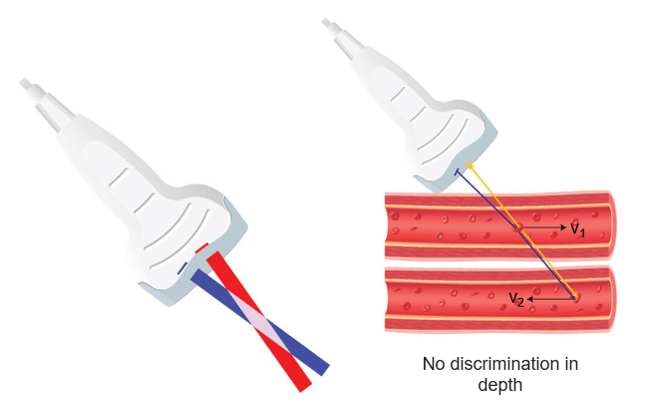
Now, let’s discuss the Color Doppler ultrasound where the color flow button activates the color flow, which adds a superimposed area to the 2-D real-time image on the screen. The operator can control the size and location of the color area on the 2D image. The color flow or color Doppler detects the blood flow in the tissue and assigns a color to the blood flow depending on its direction. By convention, the red color is attributed to the blood flow moving in the direction of the transducer, and the blue color is attributed to blood moving in the opposite direction to the transducer. The operator can also control the blood flow velocity scale (pulse repetition rate) and the filter or flow threshold.
Continuous Doppler
Continuous-wave Doppler is based on the continuous transmission and reception of ultrasound waves. The advantage of Continuous Doppler is its ability to measure high velocities, which are frequently observed in pathologies of the heart such as aortic stenosis.
Pulsed Doppler
Last, pulsed Doppler is when the transducer emits pulsed ultrasound. You can switch to the pulse Doppler mode by pressing the pulsed Doppler soft keys. Ability to measure low velocity.
Principle
A Doppler ultrasound is a non-invasive technique that can be used to evaluate blood flow in arteries and veins. It can also be used to provide information regarding the perfusion of blood flow in an organ or within an area of interest. A more recent application is the investigation of tissue wall motion when evaluating the heart.
The Doppler effect in diagnostic imaging can be used to study blood flow and provides information regarding:
- The absence or presence of flow
- The direction and the velocity of the blood flow
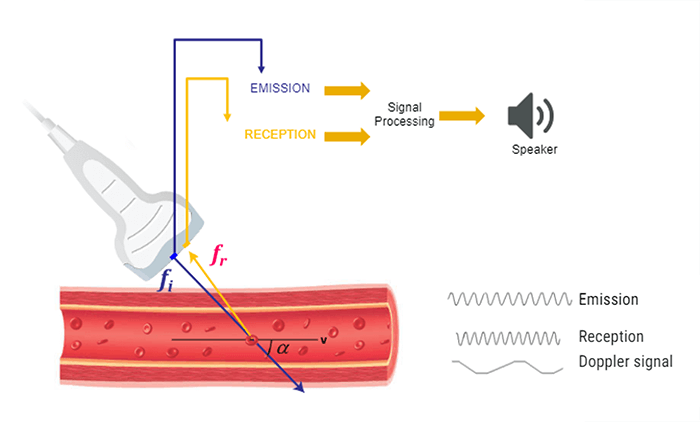
The same transducer acts as a transmitter and receiver in Doppler ultrasound applications. When using Doppler ultrasound technique to examine the blood flow in a vessel, the returning backscattered echoes from blood are detected by the transducer. These returning signals (Fr) are then processed to detect any frequency shifts by comparing these signals to the transmitted Doppler signals (Ft). The frequency shift detected will depend on two factors: the magnitude and the direction of the blood flow.
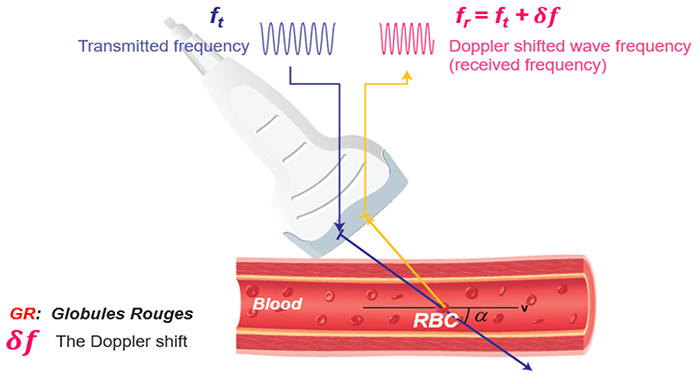
Doppler Equation
Let’s consider an example of a simple blood vessel. As shown in this figure, the transducer will first transmit a signal with frequency Ft, then this transmitted signal will reach a blood vessel. The transducer will receive the backscattered signals coming from the red blood cells at a frequency Fr.
The Doppler frequency shift (δf) is calculated by subtracting the transmitted signal Ft from the received signal Fr. As mentioned previously, this effect is used to study blood flow by measuring the frequency shift of echoes scattered by moving red blood cells.
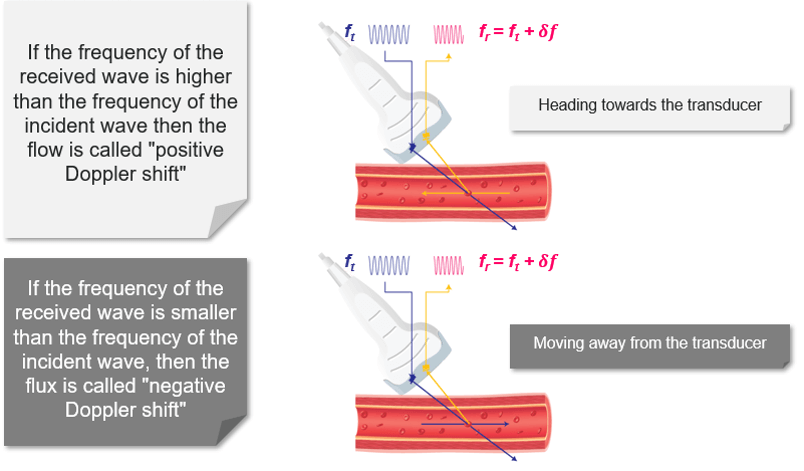
Direction and Speed of Flow
Blood flow moving towards the probe produces positive Doppler shifted signal. On the other hand, blood flow moving away from the probe produces negative Doppler-shifted signals. The image on the top illustrates the change in the received backscattered signals and the resulting Doppler shifts for blood moving towards the transducer. In this image, the relative direction of the blood flow with respect to the Doppler beam is towards the transducer, blood flow moving towards the transducer produces received signals (Fr) which have a higher frequency than the transmitted beam (Ft).
The Doppler-shifted signal (δf) can be calculated by subtracting Ft from Fr and produces a positive Doppler shifted signal. The Doppler-shifted signal (δf) can be calculated by subtracting Ft from Fr and produces a positive Doppler shifted signal. Whereas, the second image illustrates blood flow which is moving away from the probe. Blood flow moving away from the transducer produces received signals (Fr) of lower frequency than the transmitted beam (Ft). This time the Doppler-shifted frequencies (Fr − Ft) produce a negative Doppler shifted signal. It is important to note that when there is no flow or movement detected, the transmitted frequency (Ft) is equal to the received frequency (Fr). Therefore Fr = Ft and The Doppler-shifted signal (δf) = Fr − Ft = 0, resulting in no Doppler-shifted signals.
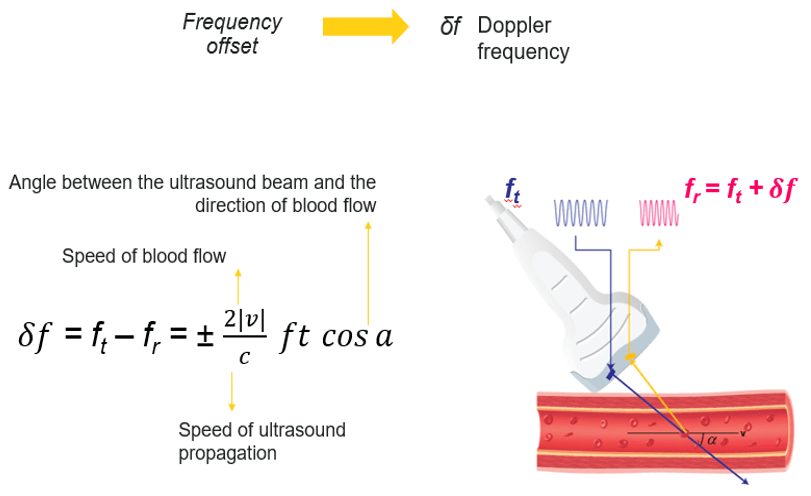
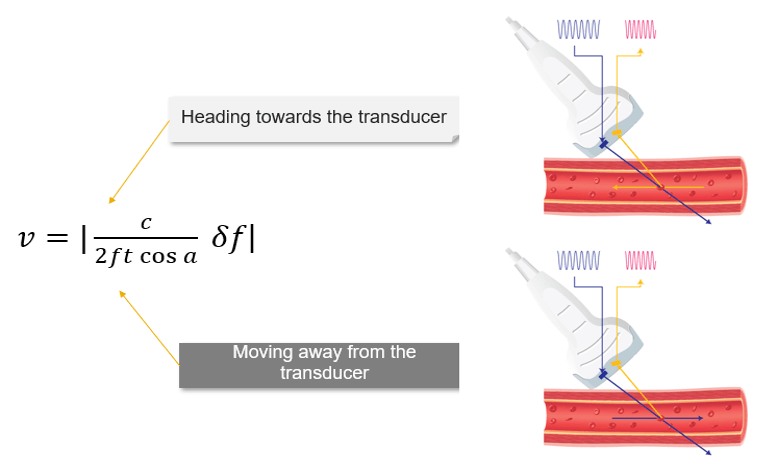
The Doppler equation shows the relationship between the transmitted Doppler shifted signal (Ft) and the blood flow velocity (V): V = c/(2ft cos a).δf, where the following represent: δf is the Doppler-shifted signal, Ft is the transmitted Doppler frequency, c is the propagation speed of ultrasound in soft tissue, V is the velocity of the moving blood, and a is the angle between the Doppler ultrasound beam and the direction of blood flow.
The number 2 is a constant indicating that the Doppler beam must travel to the moving target and then back to the transducer.
Effect of Angle
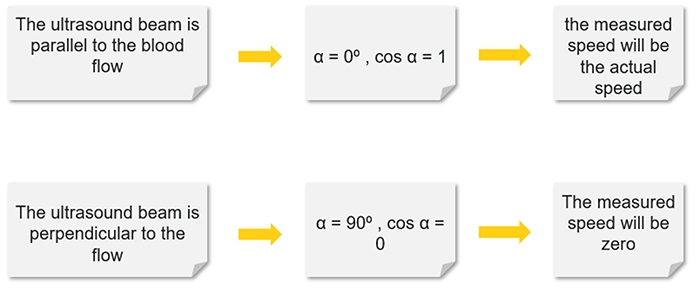
Note that the Doppler frequency also varies according to the angle alpha. The value of cosα varies with the angle from 0 to 1. When α = 0°, cosα = 1 and when α = 90°, cosα = 0.
For a constant flow velocity (V), the maximum value of cosα and therefore the highest value of the Doppler-shifted signal (δf) is at an angle of 0°. This corresponds to a Doppler beam which is parallel with the vessel, which can rarely be achieved in practice.
Theoretically, when α = 90° this means the blood flow is perpendicular to the Doppler beam, cosα = 0 and no Doppler-shifted signals will register.
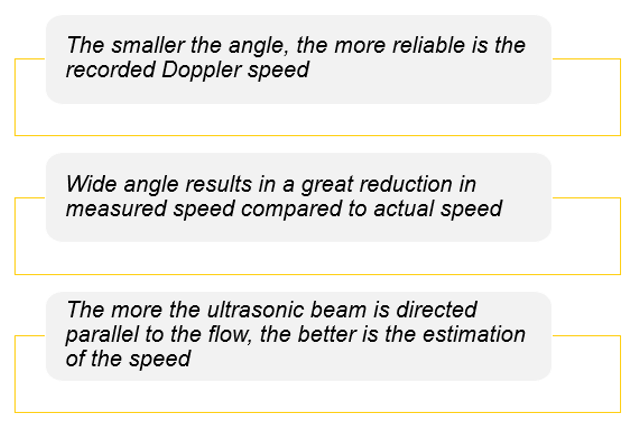
In practice, when measuring the blood flow, a Doppler beam angle between 30 and 60° ensures reliable Doppler-shifted signals. Avoid using angles greater than 60 degrees and remember no Doppler-shifted signals are generated at 90 degrees. The smaller the angle, the more reliable is the recorded Doppler speed.
Doppler Signal
Ultrasound machines transmit high-frequency waves between 2 and 20 MHz. Measuring the blood flow velocities using the Doppler technique gives Doppler-shifted signals which lie within the audible range. Therefore, all Doppler systems have audio outputs and are very useful during a Doppler examination.
The Doppler frequencies will be processed and it will be possible to analyze the blood flow velocities by simply hearing the Doppler signal through loudspeakers. Hearing the Doppler signal also allows the sonographer to easily distinguish between laminar and turbulent flows. Please note that laminar flows produce a uniform sound, while turbulent flows, emit a sharp sound.
Continuous Doppler
What is the Principle of continuous Doppler?
Continuous-wave (CW) Doppler devices consist of a handheld unit with an integrated speaker that is connected to the transducer. The transducer consists of two piezoelectric elements: one element acts as a continuous transmitter (Ft) and the other one acts as a continuous receiver (Fr). Continuous Doppler continuously emits ultrasound and the frequencies reflected by the red blood cells are thus analyzed continuously.
It is important to keep a constant angle between the ultrasound beam and the vector of the red blood cell flow to collect a Doppler signal whose frequency variations exclusively reflect the changes in the blood velocity. Continuous-wave (CW) Doppler can measure very high velocities, but it is unable to pinpoint where on the scan line they come from.
The main disadvantage of these continuous emission devices is their inability to discriminate between two vessels at different depths. Despite this disadvantage, continuous Doppler devices are effective in studying the permeability of blood vessels or fetal heart function.
Pulsed Doppler
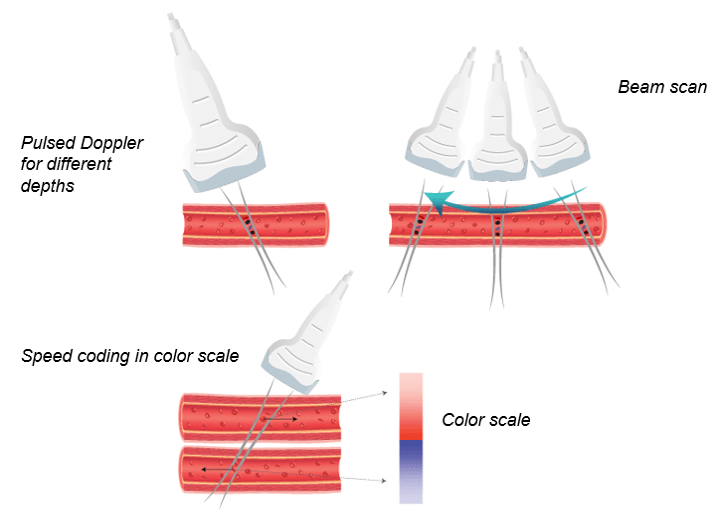
In general, Doppler ultrasound and obstetric ultrasound scanners use pulsed wave ultrasound. This allows the measurement of the depth of the flow site. In pulsed Doppler systems, an ultrasonic sensor emits a brief pulse at a regular time interval, then goes into receive mode immediately after each transmission.
An observation window called the “Doppler window” selects the echoes scattered by the red blood cells moving at a given depth. The velocity of the red blood cells is measured at a specific depth that can be adjusted.
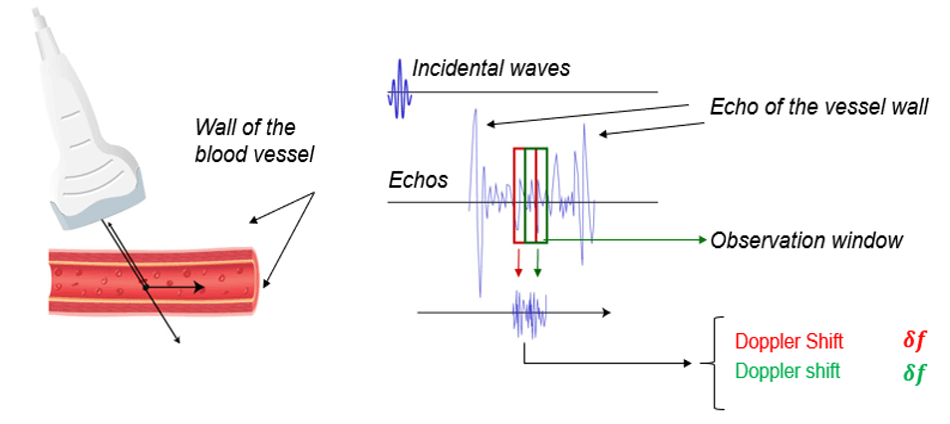
Unfortunately, the pulsed Doppler system presents many disadvantages. First, this system is unable to measure high velocities. Second, pulsed wave systems suffer from a fundamental limitation, which is the aliasing artifact.
However, there is a method for speed estimation, which in principle makes it possible to overcome the phenomenon of aliasing: it consists of directly estimating the displacement of the targets from the time lag of the echoes between two consecutive shots by a correlation method. This method does not involve the phase, echoes, nor the repetition rate (PRF), so there is no aliasing phenomenon when detecting RBC of high speed.
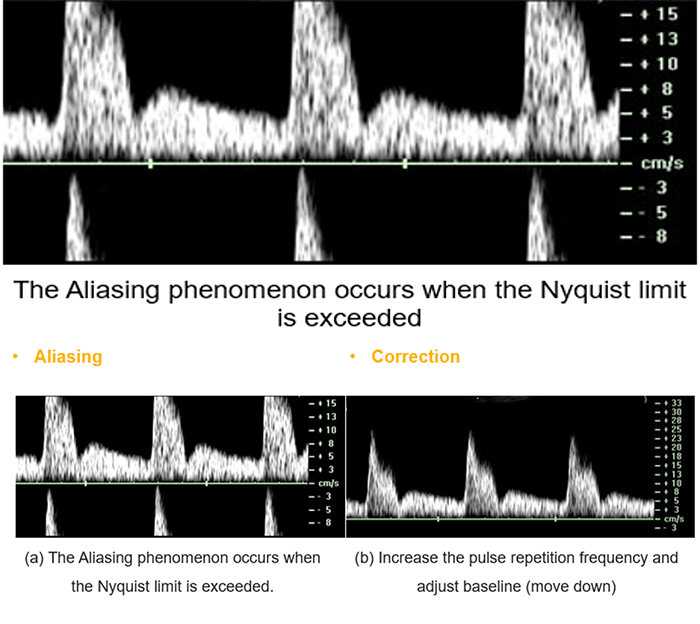
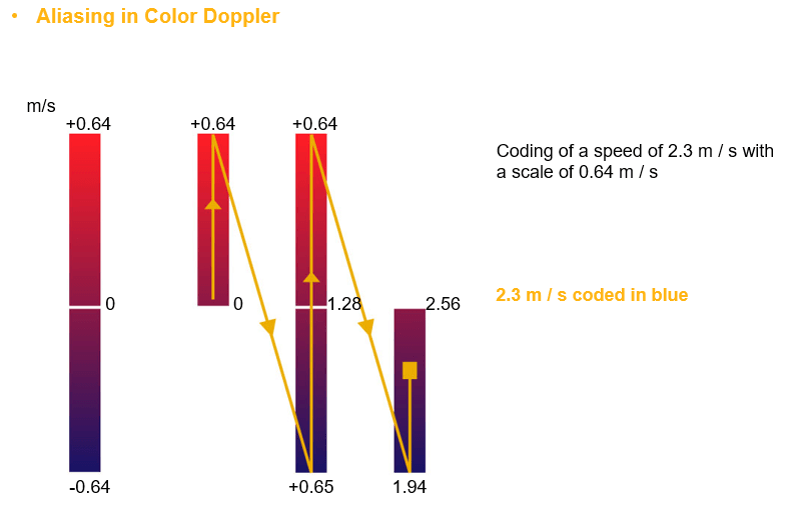
Aliasing
Pulsed Doppler systems suffer from a fundamental limitation. When pulses are transmitted at a given sampling frequency, the maximum Doppler frequency that can be measured is half the pulse repetition frequency, also known as the Nyquist theorem. If the blood velocity and the adapted beam/flow angle give a Doppler frequency value greater than half of the pulse repetition frequency, ambiguity in the Doppler signal occurs. This ambiguity is known as aliasing.
For example, pulsed Doppler is used in obstetrics to measure the flow of the umbilical and fetal arteries.
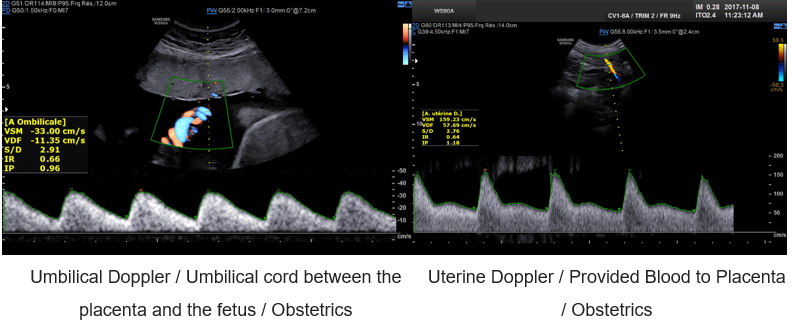
Color Doppler
What is Color Doppler?
Color Doppler converts the Doppler measurements into an array of colors. It is possible to obtain 2D or 3D velocity mapping by repeating the measurement at different depths.
In other words, the color Doppler technique estimates the average velocity of flow within a vessel by color-coding the information. The direction of blood flow is assigned by the color red or blue, indicating flow toward or away from the ultrasound transducer, and is superimposed on B mode data from stationary structures within the beamwidth. By convention, blood flow traveling toward the transducer is encoded in red, and blood flow moving away from the transducer is encoded in blue.
Aliasing occurs when the Doppler shift of the moving blood is higher than half of the pulse repetition frequency. Aliased signals are presented in the wrong direction (blue instead of red and vice versa). In this example the measured speed (2.3 m/s) is greater than half of the Nyquist limit (0.64 m/s), thus instead of being colored in red, it will be presented in blue as if the RCB is moving away from the transducer.
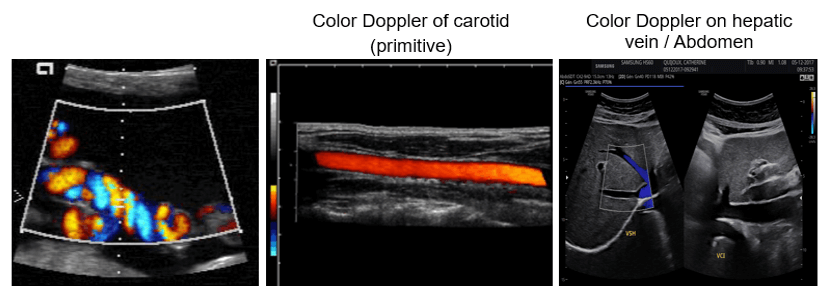
Examples of Images
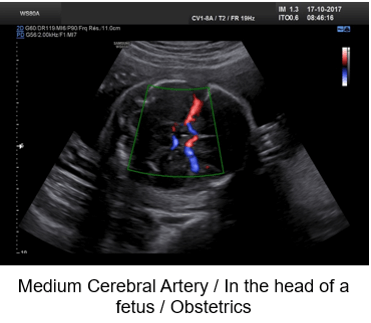
Color Doppler is mostly used in fetal and hepatic ultrasound, where the primitive carotid and the hepatic vein are well visible.
Power Doppler
Finally, we will discuss the Power Doppler technique. This technique uses the amplitude of the Doppler signal to detect moving matter. In other words, the amplitude of frequency-shifted echoes is used to form B-mode superimposed 2D Power Doppler images. Power Doppler does not determine the speed or direction of blood flow.
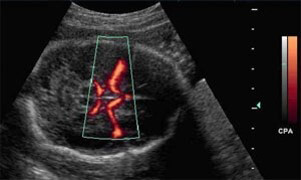
In power Doppler mode, the energy of the echoes of the moving targets is color-coded and represented in each point of the image. Power Doppler is useful when examining superficial structures, like testis, renal grafts, thyroid, and subcutaneous lesions.
However, the Power Doppler is sensitive to slow blood flows. It is also characterized by a very low temporal resolution, and it is susceptible to noise.
Non-Linear Propagation
Linear and nonlinear propagation are terms used to describe how soft tissues respond as the ultrasound wave propagates.
When the acoustic pressure of the ultrasound wave in soft tissue is small, the tissue behaves in a linear fashion, which means that the tissue expansion (rarefaction) and compression propagate at the same speed.
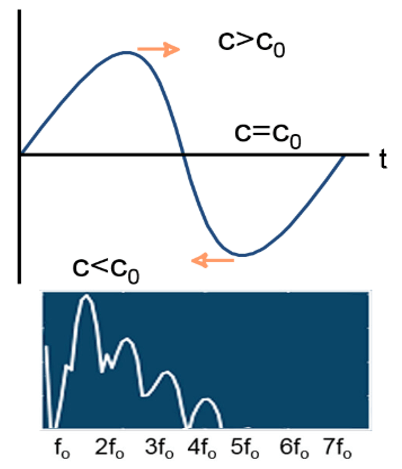
Nonlinear propagation occurs when high-pressure ultrasound waves travel through a compressible medium and the transmitted ultrasound pulse makes less compression than rarefaction.
- Propagation speed increases with density (pressure)
- The wave moves faster when the pressure is higher (peaks) and slower where it is lower (troughts)
- Any change from a perfect sinusoid creates harmonics
- The higher the amplitude, the more the effect
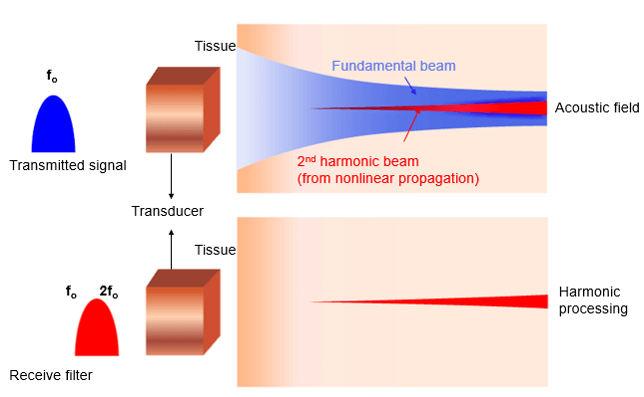
Principle
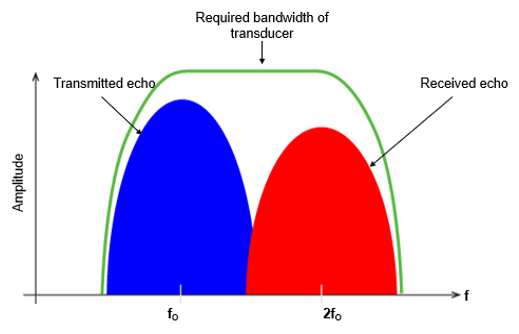
Harmonic frequencies are integer multiples of the fundamental frequency (for example if the fundamental frequency is f0, the harmonics have frequencies of 2f0, 3f0, and so on). The amplitudes of the harmonic waves are almost always lower than those of the fundamental frequency waves.
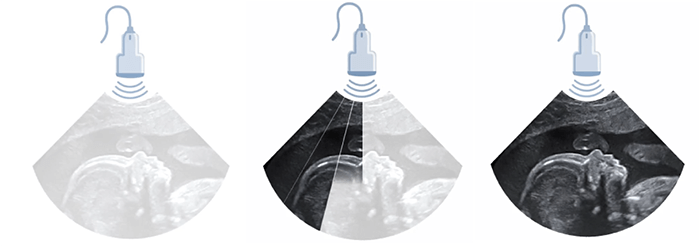
As we mentioned previously, the transmitted pulse consists of a range of frequencies centered around f0. In a linear medium, the echo pulse frequency is the same as the fundamental frequency but has lower energy, whereas the nonlinear medium results in harmonic waves of higher frequency and lower energy as shown in this figure. It is important to note that the majority of clinical US systems use second harmonic (ie, 2f0) echoes for THI image formation.
Now, let’s go deeper and explain the fundamental wave elimination techniques. The fundamental and the second harmonic frequencies are received together in the time domain as a combined distorted wave. High-quality THI primarily depends on the achievement of the complete elimination of the echoes at the fundamental frequency. Various techniques are used to remove the fundamental wave in THI, including bandwidth receive filtering, pulse inversion, side-by-side phase cancellation, and pulse-coded harmonics.
Bandwidth receive filtering is a signal processing technique in which lower frequencies that are more likely to have emerged from the fundamental beam are filtered out, and higher-frequency harmonic echoes are used to generate the image. In this technique, noise such as reverberation artifact and tissue aberrations diminishes and enhancement is improved.
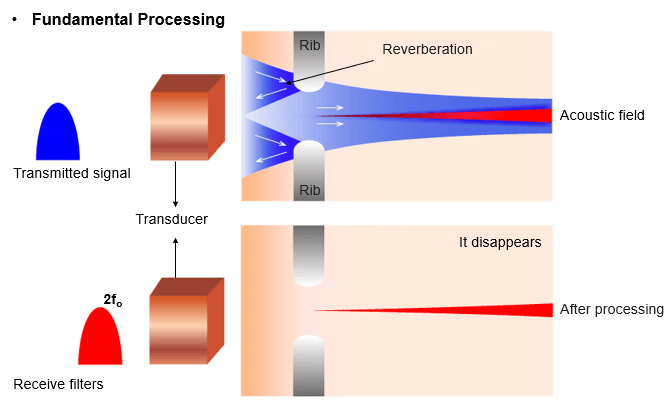
Reverberation Artifacts
What is a reverberation artifact?
Reverberation artifact occurs when the ultrasound beam encounters two highly reflective structures. It reflects between lungs, ribs, and skin. When the ultrasound beam reflects back and forth between the highly reflective structures, the ultrasound transducer interprets the sound waves returning as waves returning from deeper depth since it took longer for the wave to return to the transducer.
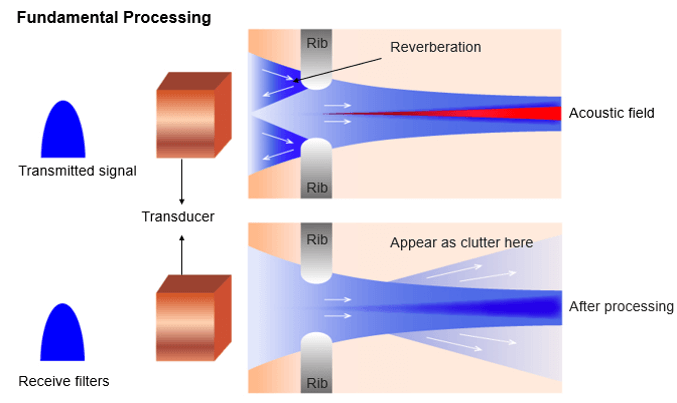
As they are of low energy (mostly equal to f0), they never develop harmonics. Therefore, receiver filters tuned at harmonic frequency remove reverberations at f0 and clean up the image.
Tissue Aberrations
Harmonic imaging is also used for aberration corrections. Aberration phenomenon occurs when the ultrasonic waves are distorted due to local changes in the speed of sound. Shallow fat and skin layers distort sound beam. It is important to know that distortions are of low energy but send sound in random directions.
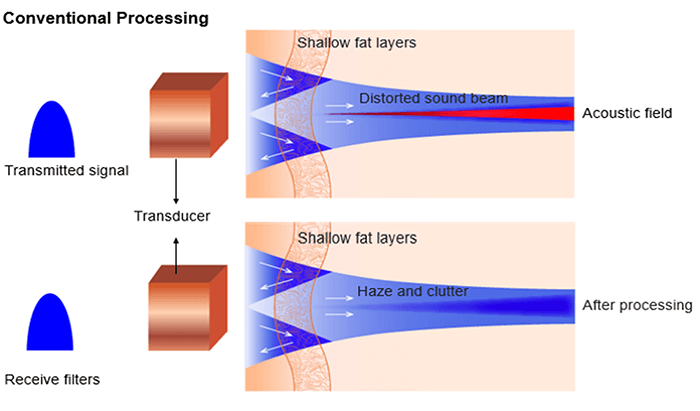
As aberrations are also of low energy, they never develop harmonics. Therefore receiver filters tuned at harmonic frequency remove aberrations at f0 and clean up the image.
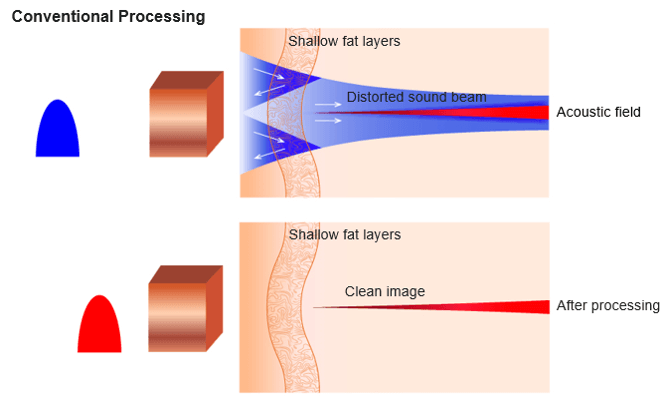
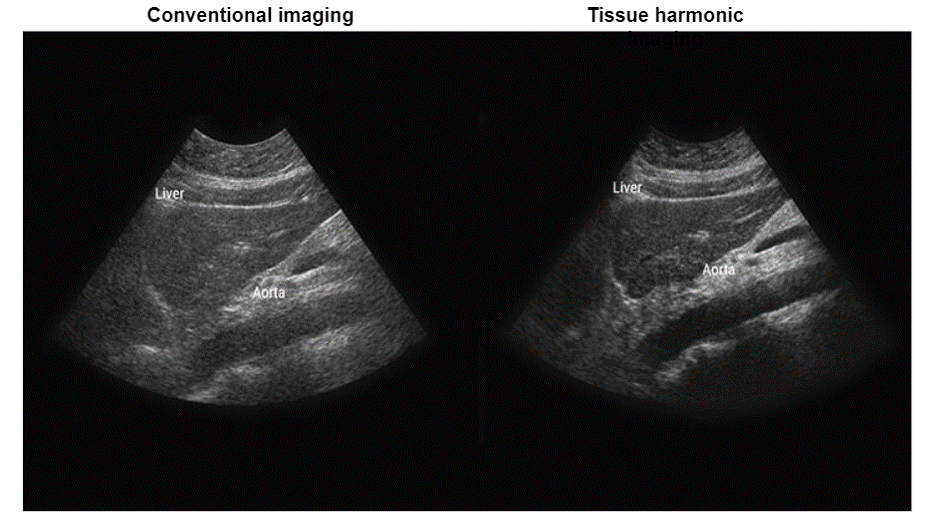
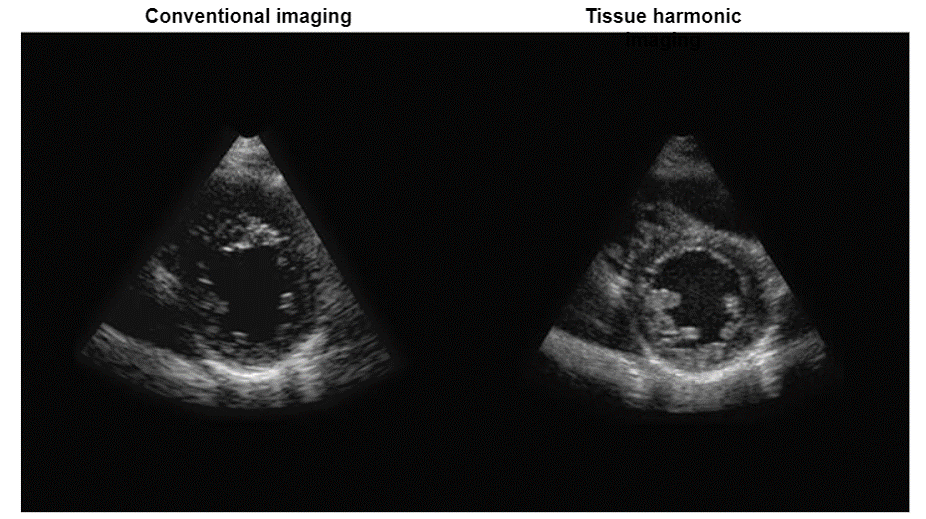
Clinical Advantages
The advantages of harmonic imaging include, but are not limited to improved signal-to-noise ratio and reduced artifacts, or better axial and lateral resolutions due to higher frequencies and narrower beams.
Post-Test & CE Certificate:
Add to CartPrice: $4.00
| ✔ | Approved by the ASRT (American Society of Radiologic Technologists) for 1 Category A CE Credit |
| ✔ | License duration: 6 months from purchase date |
| ✔ | Meets the CE requirements of the following states: California, Texas, Florida, Kentucky, Massachusetts, and New Mexico |
| ✔ | Meets the ARRT® CE reporting requirements |
As per the ARRT regulations, you have up to 3 attempts to pass the Post-Test with a minimum score of 75%.
Upon the successful completion of the Post-Test (score 75% or more), you will need to fill up a 1 min survey and then you will be able to issue your CE Certificate immediately.
Refund Policy: Non-Refundable
